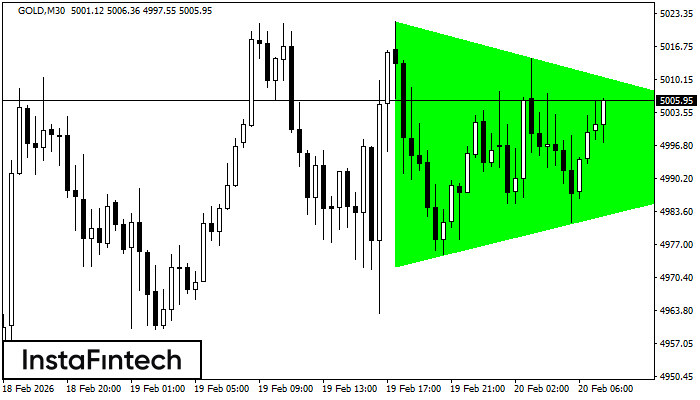
GOLD M30
Bullish Symmetrical Triangle
According to the chart of M30, GOLD formed the Bullish Symmetrical Triangle pattern, which signals the trend will continue. Description. The upper border of the pattern touches the coordinates 5021.73/4996.17 whereas the lower border goes across 4972.62/4996.17. The pattern width is measured on the chart at 4911 pips. If the Bullish Symmetrical Triangle pattern is in progress during the upward trend, this indicates the current trend will go on. In case 4996.17 is broken, the price could continue its move toward 4996.47.
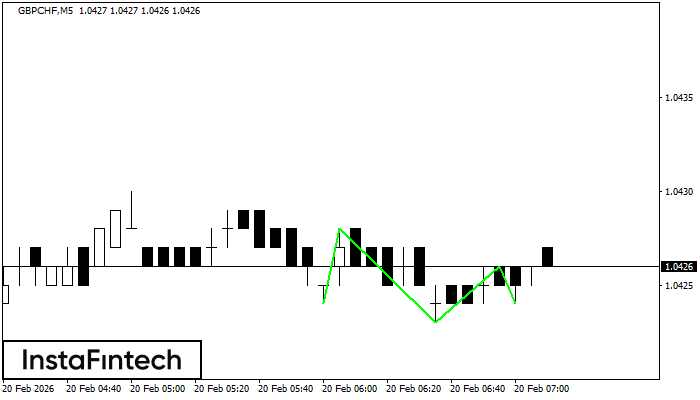
GBPCHF M5
Triple Bottom
The Triple Bottom pattern has formed on the chart of GBPCHF M5. Features of the pattern: The lower line of the pattern has coordinates 1.0428 with the upper limit 1.0428/1.0426, the projection of the width is 4 points. The formation of the Triple Bottom pattern most likely indicates a change in the trend from downward to upward. This means that in the event of a breakdown of the resistance level 1.0424, the price is most likely to continue the upward movement.
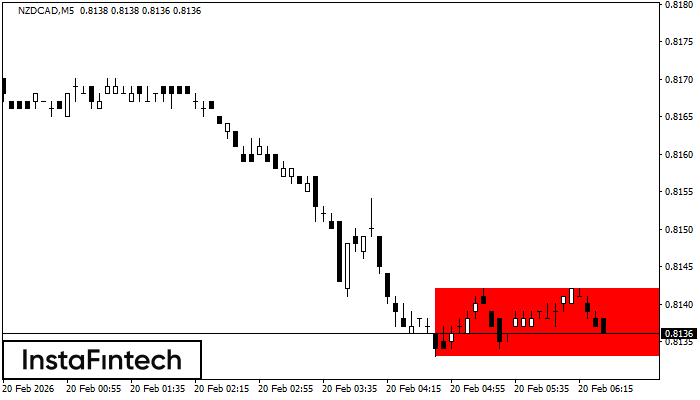
NZDCAD M5
Bearish Rectangle
According to the chart of M5, NZDCAD formed the Bearish Rectangle. The pattern indicates a trend continuation. The upper border is 0.8142, the lower border is 0.8133. The signal means that a short position should be opened after fixing a price below the lower border 0.8133 of the Bearish Rectangle.
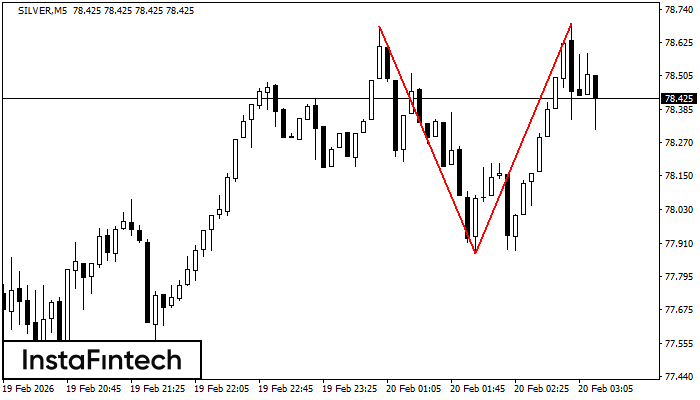
SILVER M5
Double Top
On the chart of SILVER M5 the Double Top reversal pattern has been formed. Characteristics: the upper boundary 78.69; the lower boundary 77.88; the width of the pattern 815 points. The signal: a break of the lower boundary will cause continuation of the downward trend targeting the 77.86 level.
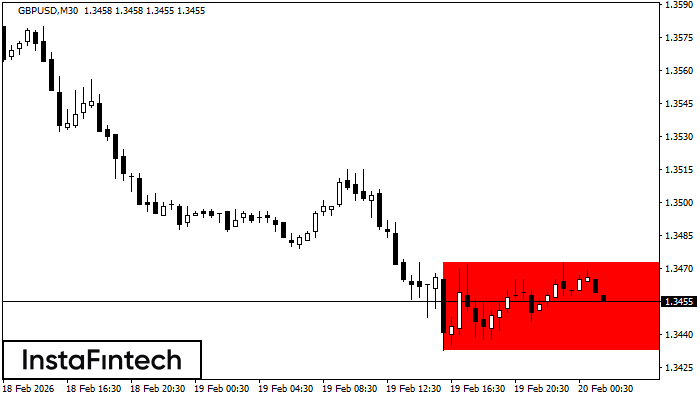
GBPUSD M30
Bearish Rectangle
According to the chart of M30, GBPUSD formed the Bearish Rectangle. This type of a pattern indicates a trend continuation. It consists of two levels: resistance 1.3473 - 0.0000 and support 1.3433 – 1.3433. In case the resistance level 1.3433 - 1.3433 is broken, the instrument is likely to follow the bearish trend.