 বাংলা
বাংলা  Русский
 English
 Bahasa Indonesia
 Bahasa Malay
 ไทย
ไทย Español
 Deutsch
 Български
 Français
 Tiếng Việt
 中文
中文 हिन्दी
 Čeština
 Українська
 Română
FX.co ★ Actual patterns. Technical analysis and trading recommendations

টেকনিক্যাল অ্যানালাইসিস প্যাটার্ন
There is nothing more precious to a trader than an ability to predict a further price movement. Technical analysis is a key to your successful transaction. At the same time, you can rely on common and recurring situations that arise in the same circumstances. Our Technical Analysis Patterns section features all trading recommendations based on the technical analysis patterns that help traders make projections and turn a profit.
Instrument:
All
#Bitcoin
EURCHF
EURGBP
EURJPY
EURUSD
EURCAD
EURRUB
EURNZD
USDCAD
USDCHF
USDJPY
USDRUB
NZDCAD
NZDUSD
NZDCHF
NZDJPY
AUDCAD
AUDCHF
AUDJPY
AUDUSD
GBPUSD
GBPJPY
GBPAUD
GBPCHF
GOLD
SILVER
#AAPL
#AMZN
#EBAY
#FB
#GOOG
#MCD
#MA
#KO
#INTC
#MSFT
#NTDOY
#PEP
#TSLA
#TWTR
Figure:
All
ট্রায়াঙ্গেল
রেক্ট্যাঙ্গেল
পেন্যান্ট
ফ্ল্যাগ
হেড অ্যান্ড শোল্ডার্স
ডাবল টপ
ট্রিপল টপ
Timeframe:
All
M5
M15
M30
H1
D1
Signal strength:
All
High
Medium
Low
Signal direction:
All
Buy
Sell
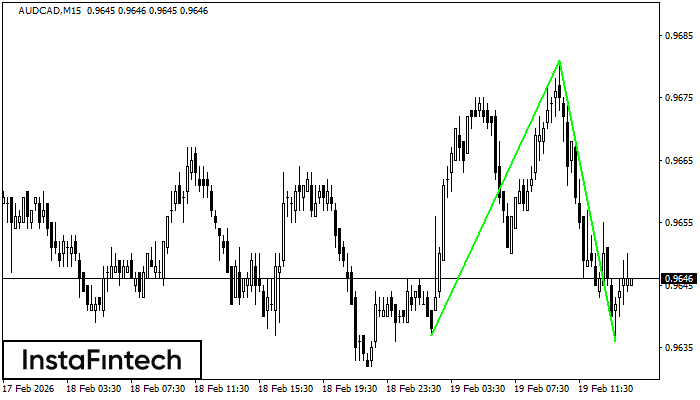
AUDCAD M15
ডাবল বটম
M15 চার্টে, AUDCAD-এর ডাবল বটম প্যাটার্নটি গঠিত হয়েছে। বৈশিষ্ট্য: সাপোর্ট স্তর হচ্ছে 0.9637; রেজিস্ট্যান্স স্তর হচ্ছে 0.9681; প্যাটার্নের প্রস্থ হচ্ছে 44 পয়েন্ট। রেজিস্ট্যান্স স্তর ভেদ করা হলে, 45 পয়েন্টের দূরত্বে থাকা প্রথম লক্ষ্যমাত্রা স্তরে প্রবণতা পরিবর্তনের পূর্বাভাস দেওয়া যেতে পারে।
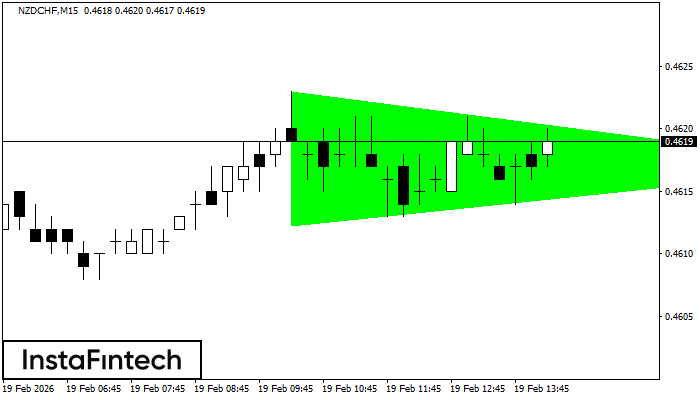
NZDCHF M15
বুলিশ সিমেট্রিকাল ট্রায়াঙ্গেল
M15 চার্ট অনুযায়ী, NZDCHF বুলিশ সিমেট্রিকাল ট্রায়াঙ্গেল প্যাটার্ন গঠন করেছে। বর্ণনা: এটি একটি ধারাবাহিক প্রবণতার প্যাটার্ন। 0.4623 এবং 0.4612 হল যথাক্রমে উপরের এবং নীচের সীমানার কোঅর্ডিনেট। চার্টে প্যাটার্নের প্রস্থ 11 পিপস পরিমাপ করা হয়েছে। পরিস্থিতি: যদি উপরের সীমানা 0.4623 ভেদ করা হয়, তাহলে মূল্য 0.4640 পিপস অগ্রসর হতে পারে।
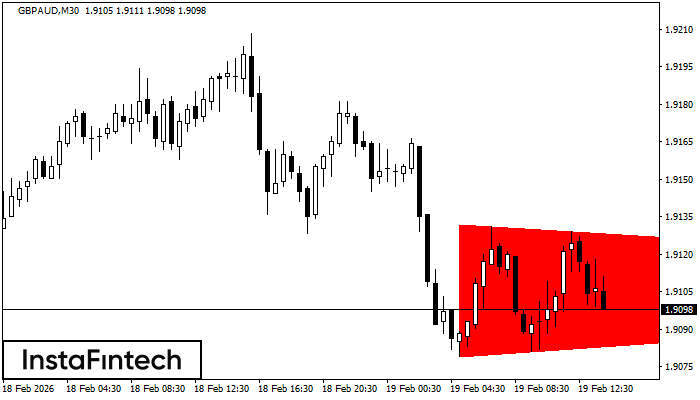
GBPAUD M30
বিয়ারিশ সিমেট্রিক্যাল ট্রায়াঙ্গেল
M30 চার্ট অনুযায়ী, GBPAUD বিয়ারিশ সিমেট্রিক্যাল ট্রায়াঙ্গেল প্যাটার্ন গঠন করেছে। 1.9079 -এর নীচের সীমানা লঙ্ঘন করা হলে এই প্যাটার্নটি আরও নিম্নমুখী প্রবণতার সংকেত প্রদান করে। এখানে, সম্ভাব্য মুনাফা উপলব্ধ প্যাটার্নের প্রস্থের সমান হবে যা -53 পিপস।
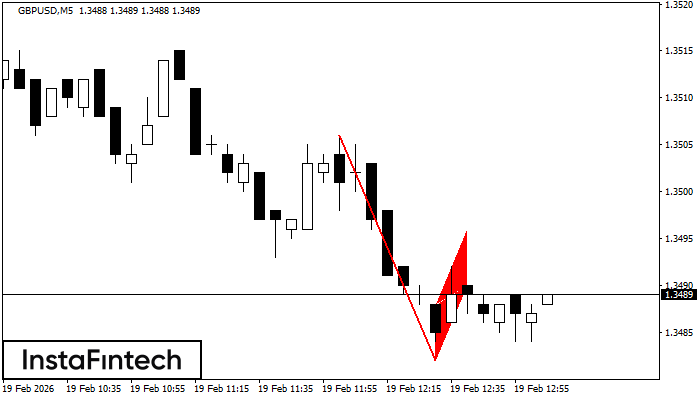
GBPUSD M5
বিয়ারিশ ফ্ল্যাগ
M5 চার্টে GBPUSD-এর বিয়ারিশ ফ্ল্যাগ প্যাটার্ন গঠিত হয়েছে। এই প্যাটার্নের নীচের সীমানা 1.3482/1.3490 -এ অবস্থিত এবং উপরের সীমানা 1.3488/1.3496-এ অবস্থিত। ফ্ল্যাগপোলের প্রজেকশন হল 24 পয়েন্ট। এই গঠনটি এই ইঙ্গিত দেয় যে নিম্নমুখী প্রবণতা অব্যাহত থাকার সম্ভাবনা সবচেয়ে বেশি। তাই, যদি মূল্য 1.3482-এর স্তর ভেদ করা, তাহলে মূল্য আরও নীচের দিকে চলে যাবে।
GBPUSD M5
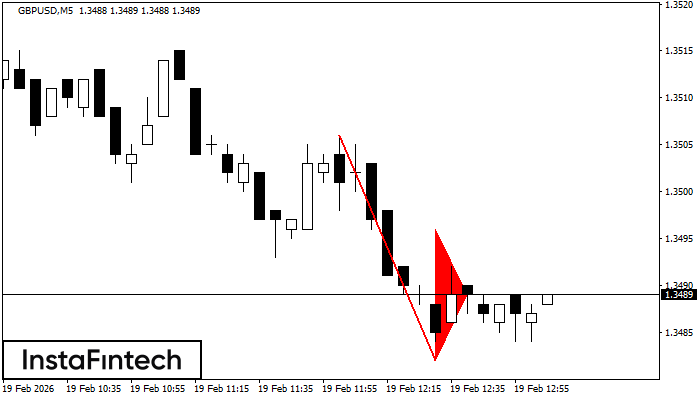
বিয়ারিশ পেন্যান্ট
M5 চার্টে GBPUSD-এর বিয়ারিশ পেন্যান্ট প্যাটার্ন গঠিত হয়েছে৷ এটি বিদ্যমান প্রবণতার সম্ভাব্য ধারাবাহিকতার ইঙ্গিত দেয়। স্পেসিফিকেশন: প্যাটার্নের নীচে 1.3482 কোঅর্ডিনেশন রয়েছে; ফ্ল্যাগপোলের উচ্চতার প্রজেকশন 24 পিপসের সমান। যদি এই প্যাটার্নের 1.3482 এর নীচের অংশ ভেদ করা হয়, তাহলে 1.3467-এর পর্যন্ত নিম্নমুখী প্রবণতা অব্যাহত থাকবে বলে আশা করা হচ্ছে।

GBPAUD M30
ডাবল বটম
M30 চার্টে, GBPAUD-এর ডাবল বটম প্যাটার্নটি গঠিত হয়েছে। এই প্যাটার্নের গঠন এই সংকেত প্রদান করে যে মূল্য বিপরীতমুখী হয়ে নিম্নমুখী থেকে ঊর্ধ্বমুখী প্রবণতা প্রদর্শন করবে। এই প্যাটার্নের উপরের সীমানা 1.9131 ব্রেক করার পরে বাই ট্রেড খোলা উচিত। পরবর্তী মুভমেন্ট বর্তমান প্যাটার্ন 52 পয়েন্টের প্রস্থের উপর নির্ভর করবে।
GBPUSD M5
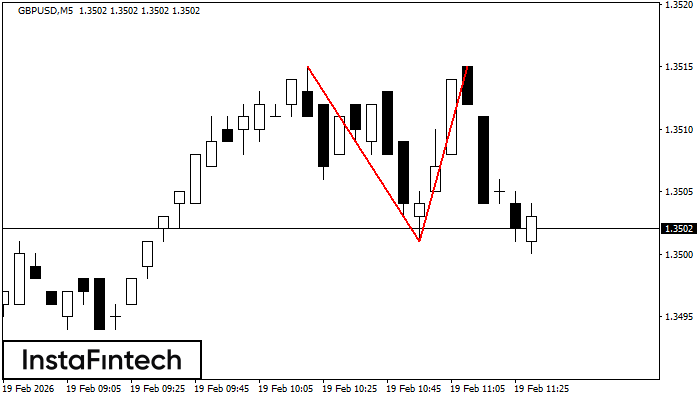
ডাবল টপ
M5 চার্টে, GBPUSD-এর ডাবল টপ প্যাটার্নটি গঠিত হয়েছে। এটি এই ইঙ্গিত দেয় যে চলমান প্রবণতা ঊর্ধ্বমুখী থেকে নিম্নমুখীতে পরিবর্তিত হয়েছে। সম্ভবত, যদি 1.3501 প্যাটার্নের ভিত্তিটি ব্রেক করা হয়, তাহলে নিম্নমুখী মুভমেন্ট চলমান থাকবে।
NZDUSD M5
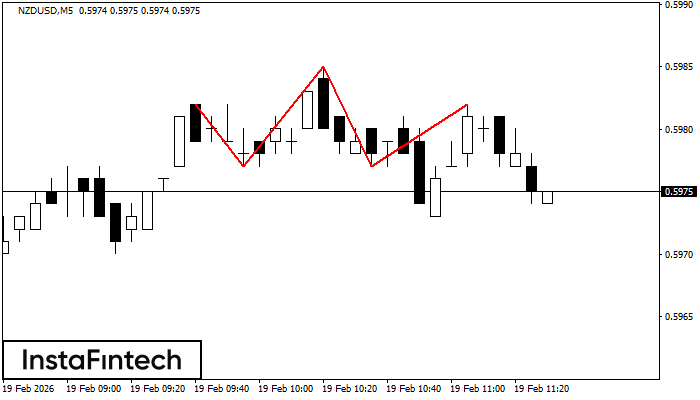
হেড অ্যান্ড শোল্ডার্স
M5 চার্টে, NZDUSD-এর হেড অ্যান্ড শোল্ডার্স টেকনিক্যাল প্যাটার্ন গঠিত হয়েছে৷ ডান দিকের শোল্ডার গঠন হওয়ার পরে মূল্য 0.5977/0.5977-এর নেকলাইনকে ছাড়িয়ে যাবে বলে পরামর্শ দেওয়ার বেশ কিছু কারণ রয়েছে৷ সুতরাং, মূল্য 0.5962-এর দিকে যাওয়ার সাথে সাথে প্রবণতা পরিবর্তনের বিষয়টি নির্ধারিত হয়েছে।
GOLD M15
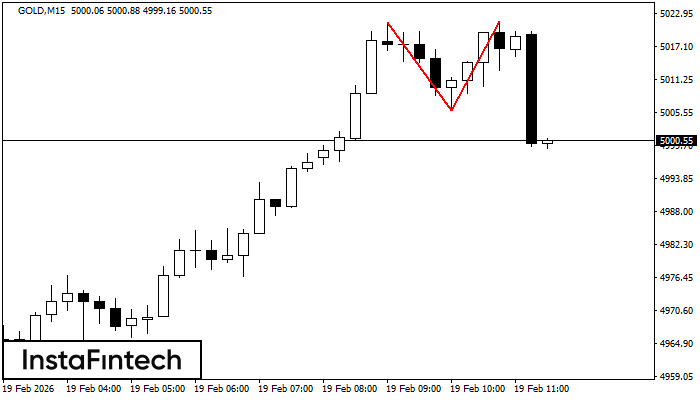
ডাবল টপ
M15 চার্টে, GOLD-এর ডাবল টপ রিভার্সাল বা বিপরীতমুখী প্যাটার্ন গঠিত হয়েছে। বৈশিষ্ট্য: উপরের সীমানা 5021.46; নীচের সীমানা 5005.88; প্যাটার্নের প্রস্থ 1558 পয়েন্ট। সংকেত: নীচের সীমানা ব্রেক করা হলে 5005.65 স্তরের দিকে নিম্নমুখী প্রবণতা অব্যাহত থাকবে।
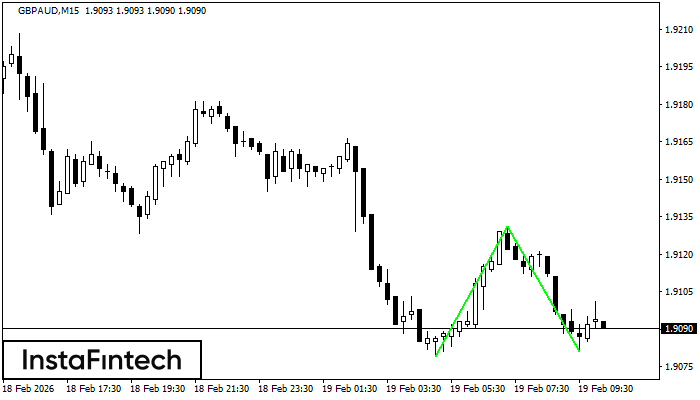
GBPAUD M15
ডাবল বটম
M15 চার্টে, GBPAUD-এর ডাবল বটম প্যাটার্নটি গঠিত হয়েছে। উপরের সীমানা হল 1.9131; নীচের সীমানা হল 1.9081। প্যাটার্নের প্রস্থ হল 52 পয়েন্ট। 1.9131-এর উপরের সীমানা ভেদ করার ক্ষেত্রে, প্রবণতা পরিবর্তনের পূর্বাভাস দেওয়া যেতে পারে যেখানে প্যাটার্নের প্রস্থ সম্ভাব্য টেক প্রফিট স্তরের দূরত্বের সাথে মিলে যাবে।