Defeat and capitulation. This is how the cryptocurrency market can be characterized. The aggressive tightening of the Fed's monetary policy, rampant growth in debt rates, the collapse of the stablecoin TerraUSD and its sister token Luna, as well as the intention of the largest crypto lender Celsius Network to suspend all withdrawals, exchanges and transfers made the bulls on BTCUSD a chop. Bitcoin went underwater, collapsing to the lowest levels over the past 1.5 years, leaving in the cold most of the buyers who bought it during this period. However, according to Bill Gates, cryptocurrencies and NFTs are assets 100% based on the fool's theory. What else did you want?
Bitcoin and its analogues were bought only because people were sure that someone would pay more for them after a while. You will not receive any interest or dividends on them. There are no issuing companies or states behind them. Buying air, the Fed only inflated the bubble with its colossal monetary stimulus, which plunged real Treasury yields deep into the red and supported the entire risky asset class.
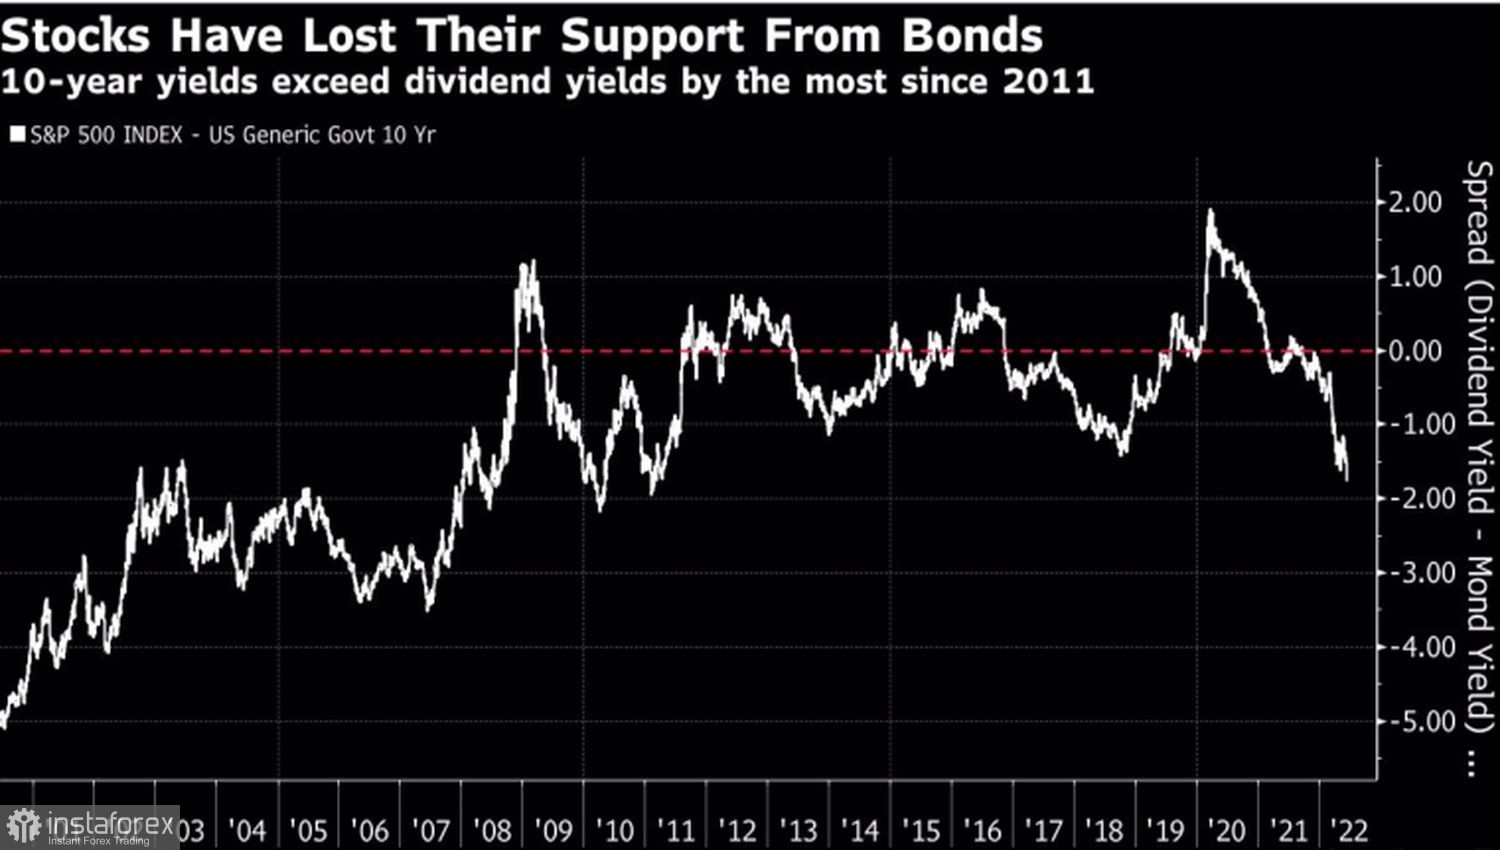
The debt sell-off triggered by the Fed's aggressive monetary tightening returned the ratio between S&P 500 stock dividend yields and bond dividend yields to the lowest levels since the 2008 recession. Financial markets have returned to the era before the Lehman crisis, when bonds did not support stocks.
Dynamics of the ratio of dividend yield on shares and interest on bonds

It is difficult to expect that a decrease in P/E to 15.7, the average value over the past 15 years, will reverse the downward trend in the S&P 500. In December 2018, the multiplier fell to 13.8, and in March 2020 to 13.4. As cheap as stocks look, they can get even cheaper. Given the close correlation between BTCUSD and the Nasdaq Composite, this does not bode well for fans of the leader in the cryptocurrency sector.
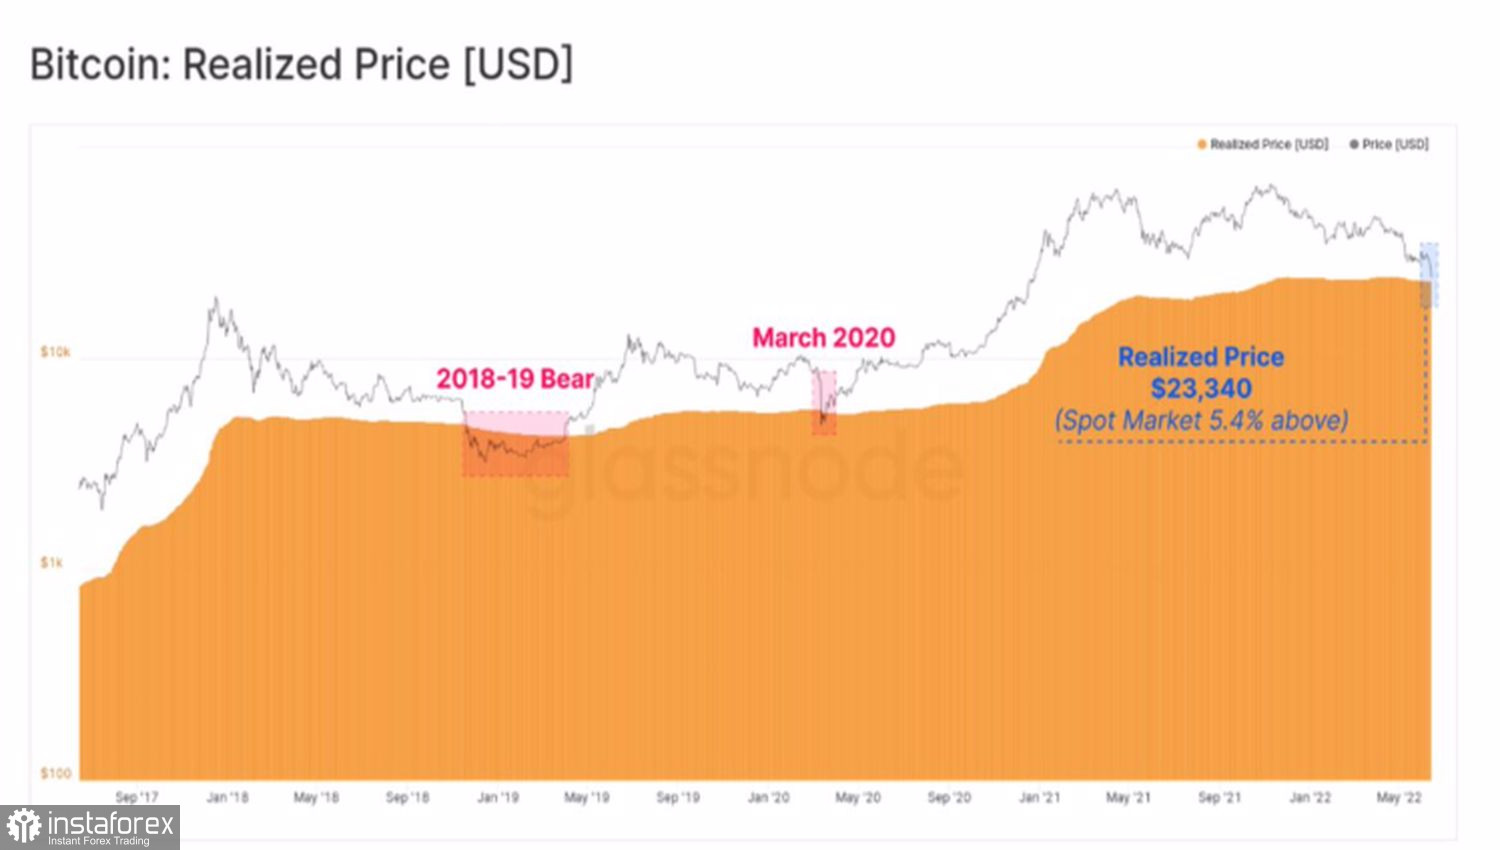
Optimists hope that Bitcoin will be able to stabilize near the round mark of 20,000, as it did in 2018–2019 with the level of 5,000 and in 2014–2015 with the level of 300. Pessimists say that the peak to 10,000 will continue. At the same time, the lower the BTCUSD quotes will sink, the faster the sales will go. This is due to the departure of the token from the average price at which it was purchased. Parallels can be drawn with diving. In previous cases, in 2018–2019 and March 2020, it turned out to be relatively short. How will it be this time?
Dynamics of BTCUSD and the average purchase price of Bitcoin

Personally, I remember the story of 2013 with gold. Then they also said that it could not sink too deep, since the cost of production is at the level of $1,300 per ounce. In fact, the precious metal almost reached $1,000.
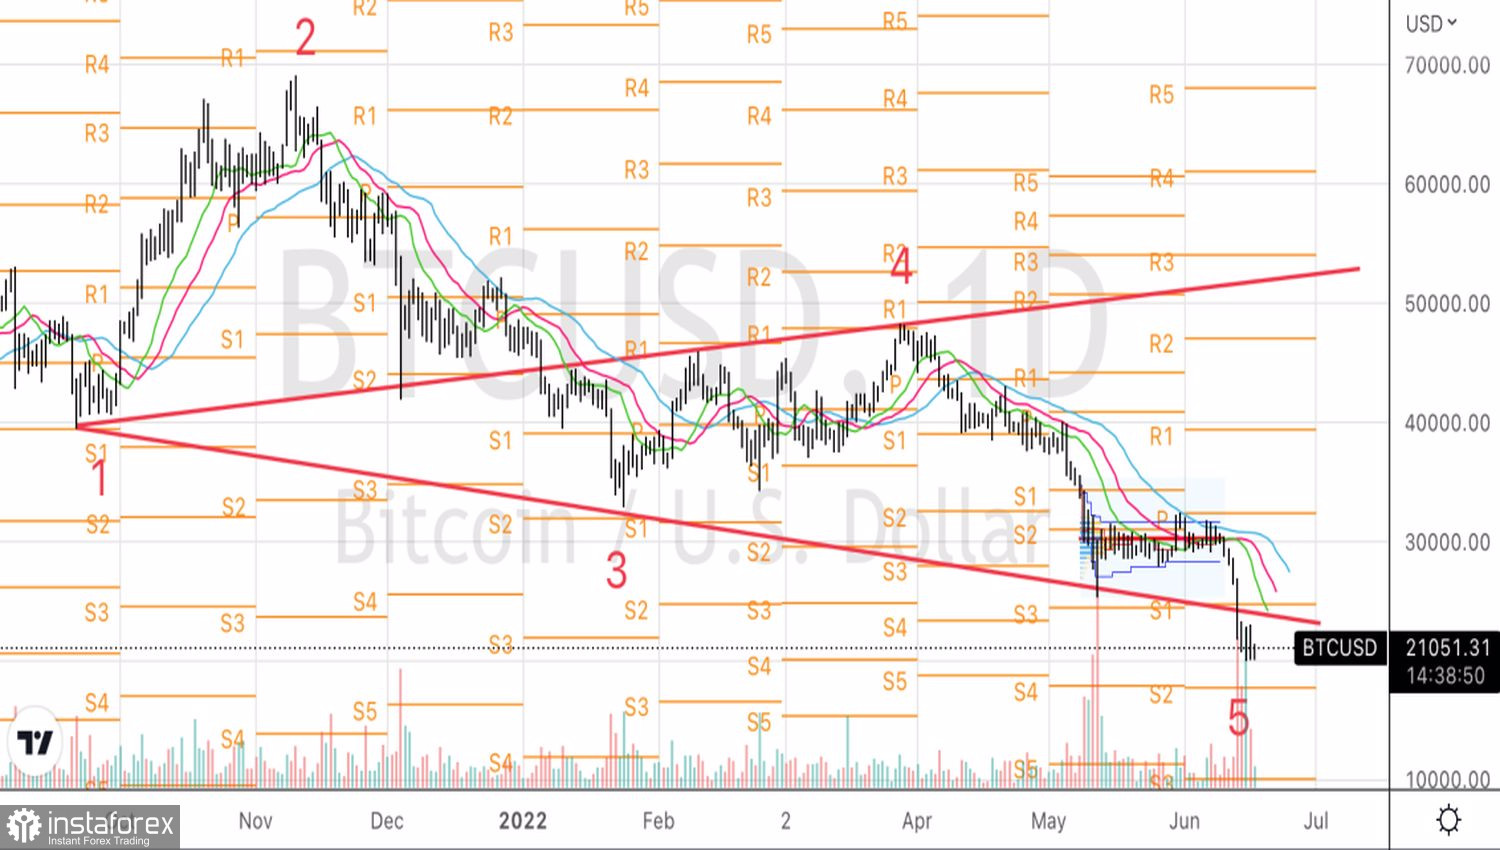
BTCUSD, Daily chart

Technically, to implement the reversal pattern of the Wolfe Wave, a return of Bitcoin to 30,000 is required. Until this happens, we use the rebound from the resistances at 23,300, 24,300, and 25,000 for sales.
 Tiếng Việt
 Русский
 English
 Bahasa Indonesia
 Bahasa Malay
 ไทย
ไทย Español
 Deutsch
 Български
 Français
 中文
中文 বাংলা
বাংলা हिन्दी
 Čeština
 Українська
 Română

