 Română
  Русский
 English
 Bahasa Indonesia
 Bahasa Malay
 ไทย
ไทย Español
 Deutsch
 Български
 Français
 Tiếng Việt
 中文
中文 বাংলা
বাংলা हिन्दी
 Čeština
 Українська
FX.co ★ Patterns NZDUSD | New Zealand Dollar (NZD) to US Dollar (USD) Rate in the Forex market

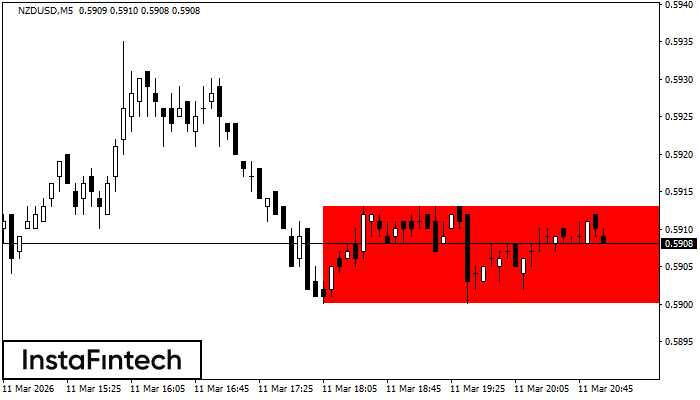
NZDUSD M5
Bearish Rectangle
According to the chart of M5, NZDUSD formed the Bearish Rectangle which is a pattern of a trend continuation. The pattern is contained within the following borders: lower border 0.5900 – 0.5900 and upper border 0.5913 – 0.5913. In case the lower border is broken, the instrument is likely to follow the downward trend.
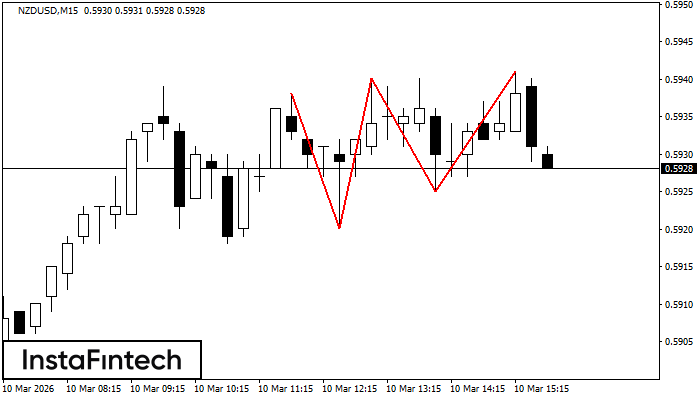
NZDUSD M15
Triple Top
The Triple Top pattern has formed on the chart of the NZDUSD M15 trading instrument. It is a reversal pattern featuring the following characteristics: resistance level -3, support level -5, and pattern’s width 18. Forecast If the price breaks through the support level 0.5920, it is likely to move further down to 0.5918.

NZDUSD M30
Double Top
The Double Top pattern has been formed on NZDUSD M30. It signals that the trend has been changed from upwards to downwards. Probably, if the base of the pattern 0.5918 is broken, the downward movement will continue.

NZDUSD M5
Triple Top
The Triple Top pattern has formed on the chart of the NZDUSD M5. Features of the pattern: borders have an ascending angle; the lower line of the pattern has the coordinates 0.5917/0.5925 with the upper limit 0.5930/0.5932; the projection of the width is 13 points. The formation of the Triple Top figure most likely indicates a change in the trend from upward to downward. This means that in the event of a breakdown of the support level of 0.5917, the price is most likely to continue the downward movement.

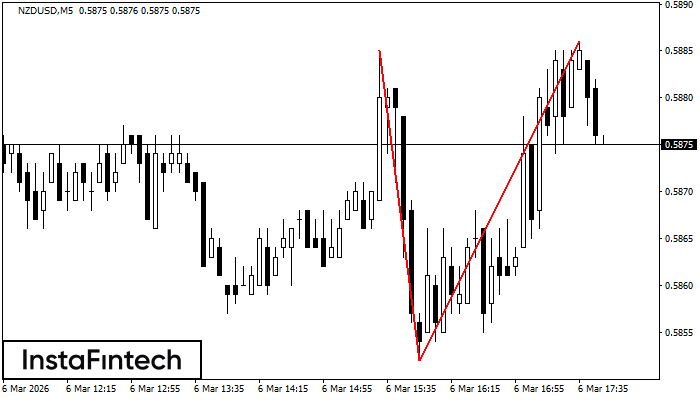
NZDUSD M5
Bullish Rectangle
According to the chart of M5, NZDUSD formed the Bullish Rectangle which is a pattern of a trend continuation. The pattern is contained within the following borders: the lower border 0.5892 – 0.5892 and upper border 0.5910 – 0.5910. In case the upper border is broken, the instrument is likely to follow the upward trend.
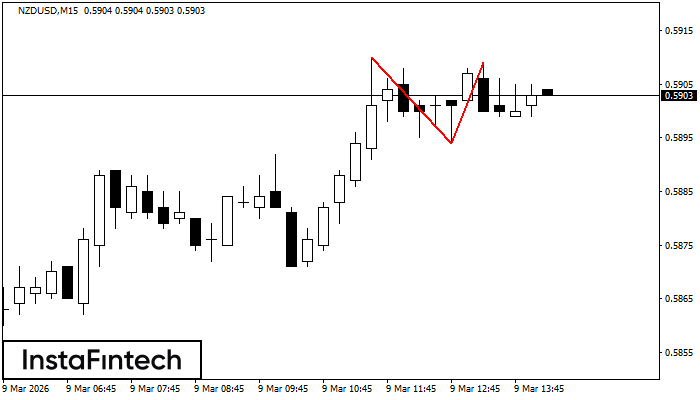
NZDUSD M15
Double Top
The Double Top pattern has been formed on NZDUSD M15. It signals that the trend has been changed from upwards to downwards. Probably, if the base of the pattern 0.5894 is broken, the downward movement will continue.
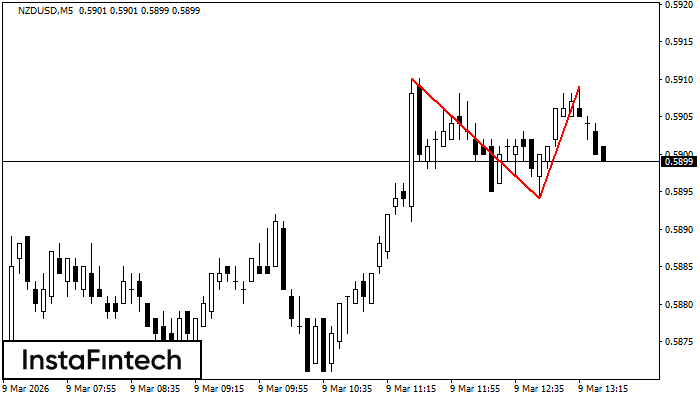
NZDUSD M5
Double Top
The Double Top pattern has been formed on NZDUSD M5. It signals that the trend has been changed from upwards to downwards. Probably, if the base of the pattern 0.5894 is broken, the downward movement will continue.
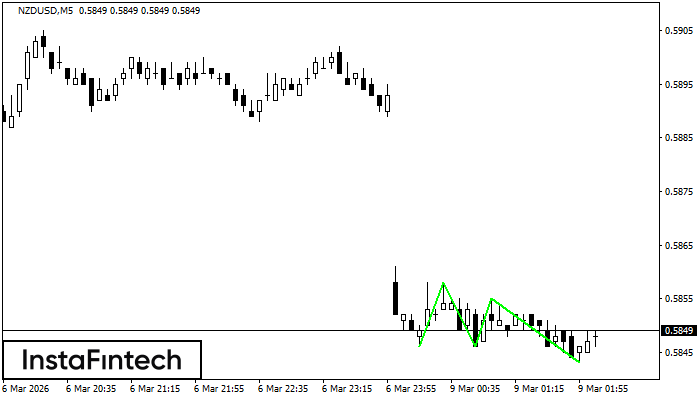
NZDUSD M5
Triple Bottom
The Triple Bottom pattern has been formed on NZDUSD M5. It has the following characteristics: resistance level 0.5858/0.5855; support level 0.5846/0.5843; the width is 12 points. In the event of a breakdown of the resistance level of 0.5858, the price is likely to continue an upward movement at least to 0.5861.

NZDUSD M5
Double Bottom
The Double Bottom pattern has been formed on NZDUSD M5. Characteristics: the support level 0.5846; the resistance level 0.5858; the width of the pattern 12 points. If the resistance level is broken, a change in the trend can be predicted with the first target point lying at the distance of 12 points.
NZDUSD M5
Double Top
The Double Top pattern has been formed on NZDUSD M5. It signals that the trend has been changed from upwards to downwards. Probably, if the base of the pattern 0.5852 is broken, the downward movement will continue.