 Română
  Русский
 English
 Bahasa Indonesia
 Bahasa Malay
 ไทย
ไทย Español
 Deutsch
 Български
 Français
 Tiếng Việt
 中文
中文 বাংলা
বাংলা हिन्दी
 Čeština
 Українська
FX.co ★ Patterns NZDJPY | New Zealand Dollar (NZD) to Japanese Yen (JPY) Rate in the Forex market

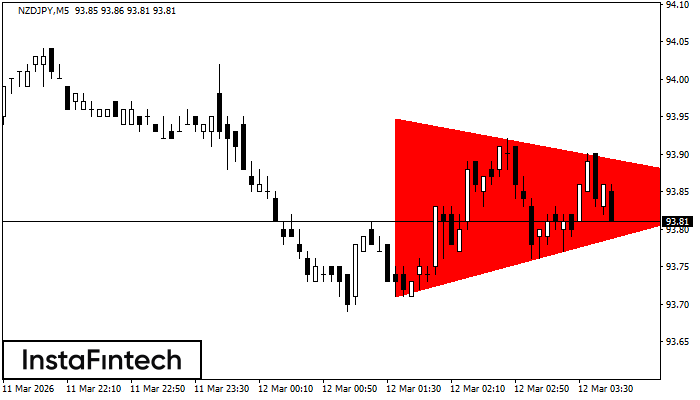
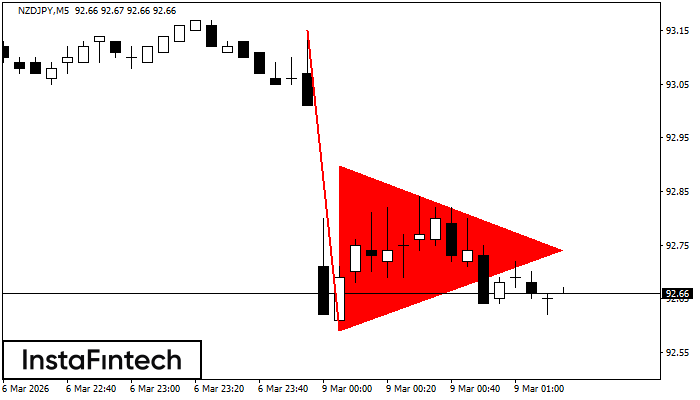
NZDJPY M5
Bearish Symmetrical Triangle
According to the chart of M5, NZDJPY formed the Bearish Symmetrical Triangle pattern. Description: The lower border is 93.71/93.85 and upper border is 93.95/93.85. The pattern width is measured on the chart at -24 pips. The formation of the Bearish Symmetrical Triangle pattern evidently signals a continuation of the downward trend. In other words, if the scenario comes true and NZDJPY breaches the lower border, the price could continue its move toward 93.70.
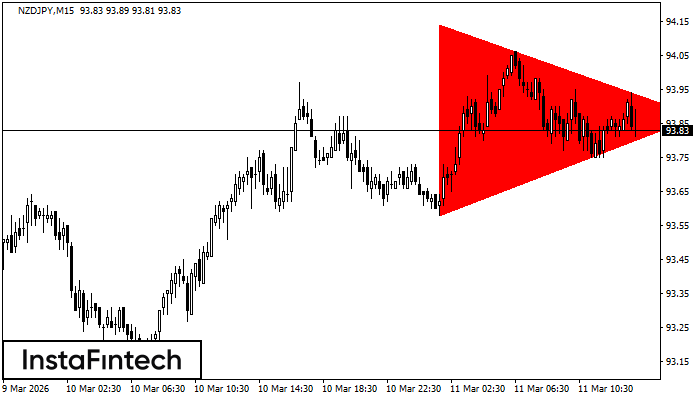
NZDJPY M15
Bearish Symmetrical Triangle
According to the chart of M15, NZDJPY formed the Bearish Symmetrical Triangle pattern. Trading recommendations: A breach of the lower border 93.58 is likely to encourage a continuation of the downward trend.
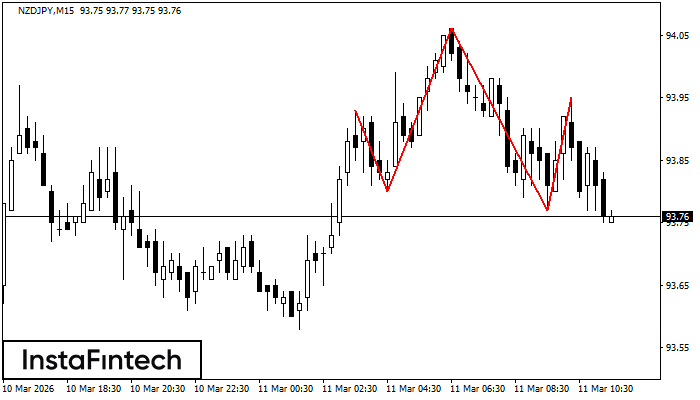
NZDJPY M15
Head and Shoulders
According to the chart of M15, NZDJPY formed the Head and Shoulders pattern. The Head’s top is set at 94.06 while the median line of the Neck is found at 93.80/93.77. The formation of the Head and Shoulders pattern evidently signals a reversal of the upward trend. In other words, in case the scenario comes true, the price of NZDJPY will go towards 93.54.

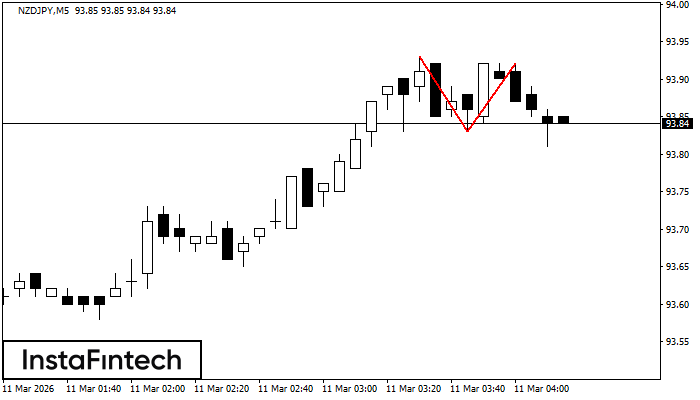
NZDJPY M5
Double Bottom
The Double Bottom pattern has been formed on NZDJPY M5; the upper boundary is 93.95; the lower boundary is 93.77. The width of the pattern is 18 points. In case of a break of the upper boundary 93.95, a change in the trend can be predicted where the width of the pattern will coincide with the distance to a possible take profit level.
NZDJPY M5
Double Top
The Double Top pattern has been formed on NZDJPY M5. It signals that the trend has been changed from upwards to downwards. Probably, if the base of the pattern 93.83 is broken, the downward movement will continue.

NZDJPY M30
Head and Shoulders
The technical pattern called Head and Shoulders has appeared on the chart of NZDJPY M30. There are weighty reasons to suggest that the price will surpass the Neckline 93.59/93.61 after the right shoulder has been formed. So, the trend is set to change with the price heading for 93.31.

NZDJPY M15
Bullish Rectangle
According to the chart of M15, NZDJPY formed the Bullish Rectangle. This type of a pattern indicates a trend continuation. It consists of two levels: resistance 93.77 and support 93.59. In case the resistance level 93.77 - 93.77 is broken, the instrument is likely to follow the bullish trend.
NZDJPY M5
Double Bottom
The Double Bottom pattern has been formed on NZDJPY M5. This formation signals a reversal of the trend from downwards to upwards. The signal is that a buy trade should be opened after the upper boundary of the pattern 93.31 is broken. The further movements will rely on the width of the current pattern 11 points.

NZDJPY M5
Bullish Rectangle
According to the chart of M5, NZDJPY formed the Bullish Rectangle which is a pattern of a trend continuation. The pattern is contained within the following borders: the lower border 93.47 – 93.47 and upper border 93.64 – 93.64. In case the upper border is broken, the instrument is likely to follow the upward trend.
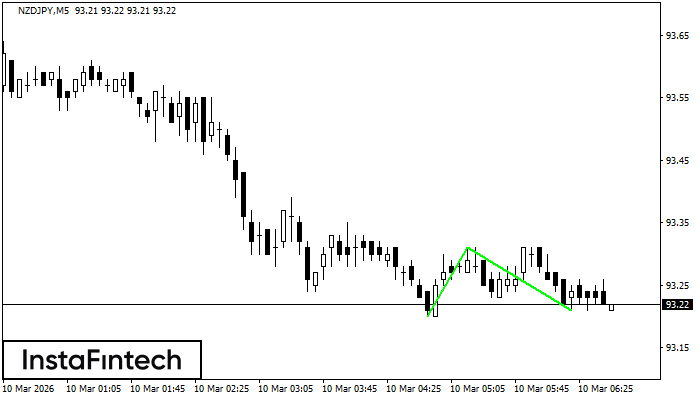
NZDJPY M5
Bearish pennant
The Bearish pennant pattern has formed on the NZDJPY M5 chart. The pattern signals continuation of the downtrend in case the pennant’s low of 92.59 is broken through. Recommendations: Place the sell stop pending order 10 pips below the pattern’s low. Place the take profit order at the projection distance of the flagpole height.