 Română
  Русский
 English
 Bahasa Indonesia
 Bahasa Malay
 ไทย
ไทย Español
 Deutsch
 Български
 Français
 Tiếng Việt
 中文
中文 বাংলা
বাংলা हिन्दी
 Čeština
 Українська
FX.co ★ Patterns NZDCAD | New Zealand Dollar (NZD) to Canadian Dollar (CAD) Rate in the Forex market

NZDCAD M5
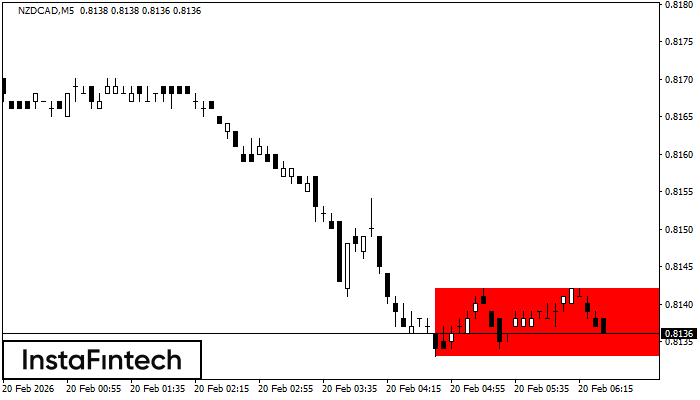
Bearish Rectangle
According to the chart of M5, NZDCAD formed the Bearish Rectangle. The pattern indicates a trend continuation. The upper border is 0.8142, the lower border is 0.8133. The signal means that a short position should be opened after fixing a price below the lower border 0.8133 of the Bearish Rectangle.
NZDCAD M5
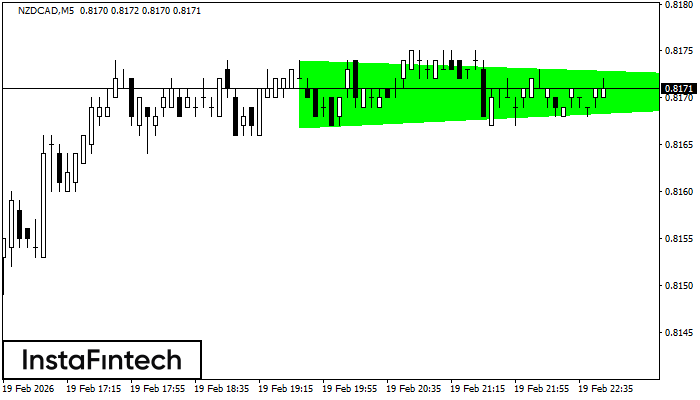
Bullish Symmetrical Triangle
According to the chart of M5, NZDCAD formed the Bullish Symmetrical Triangle pattern. The lower border of the pattern touches the coordinates 0.8167/0.8171 whereas the upper border goes across 0.8174/0.8171. If the Bullish Symmetrical Triangle pattern is in progress, this evidently signals a further upward trend. In other words, in case the scenario comes true, the price of NZDCAD will breach the upper border to head for 0.8186.
NZDCAD M5
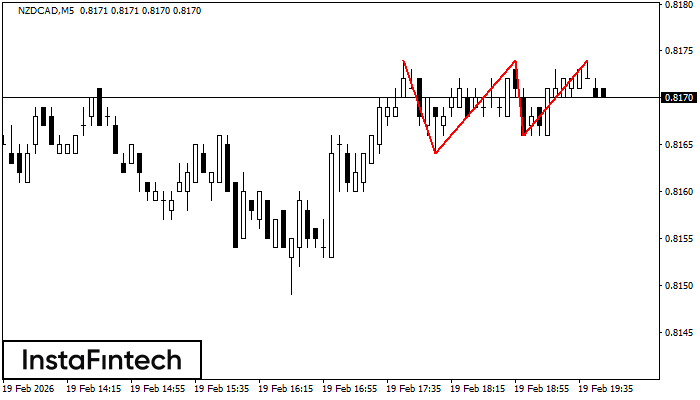
Triple Top
The Triple Top pattern has formed on the chart of the NZDCAD M5. Features of the pattern: borders have an ascending angle; the lower line of the pattern has the coordinates 0.8164/0.8166 with the upper limit 0.8174/0.8174; the projection of the width is 10 points. The formation of the Triple Top figure most likely indicates a change in the trend from upward to downward. This means that in the event of a breakdown of the support level of 0.8164, the price is most likely to continue the downward movement.
NZDCAD M5
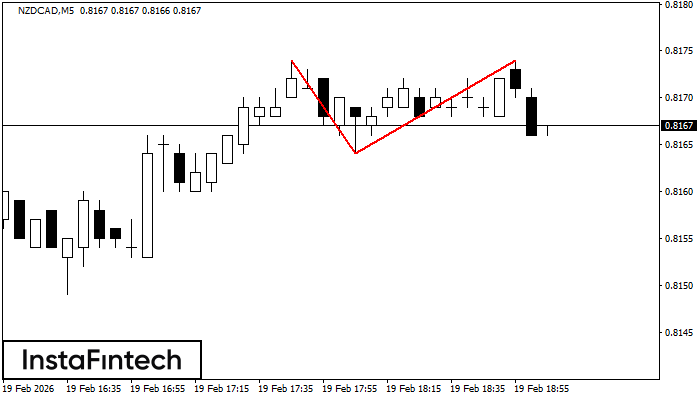
Double Top
On the chart of NZDCAD M5 the Double Top reversal pattern has been formed. Characteristics: the upper boundary 0.8174; the lower boundary 0.8164; the width of the pattern 10 points. The signal: a break of the lower boundary will cause continuation of the downward trend targeting the 0.8149 level.
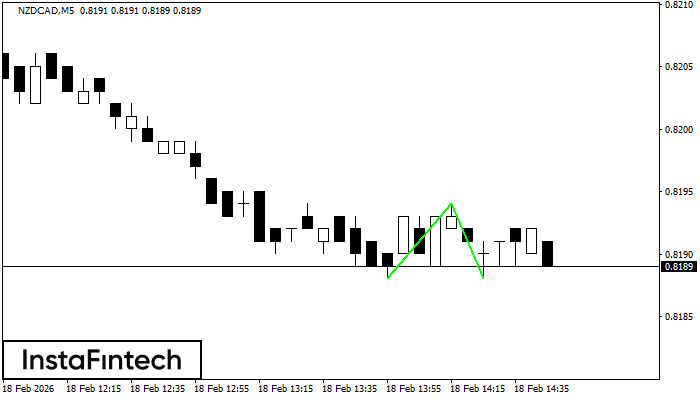
NZDCAD M5
Double Bottom
The Double Bottom pattern has been formed on NZDCAD M5. Characteristics: the support level 0.8188; the resistance level 0.8194; the width of the pattern 6 points. If the resistance level is broken, a change in the trend can be predicted with the first target point lying at the distance of 6 points.
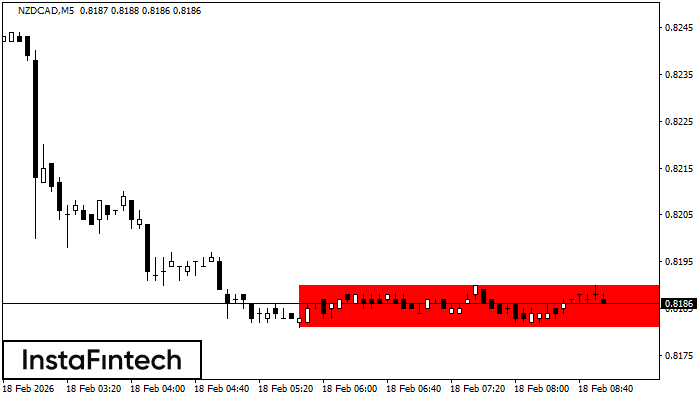
NZDCAD M5
Bearish Rectangle
According to the chart of M5, NZDCAD formed the Bearish Rectangle. The pattern indicates a trend continuation. The upper border is 0.8190, the lower border is 0.8181. The signal means that a short position should be opened after fixing a price below the lower border 0.8181 of the Bearish Rectangle.
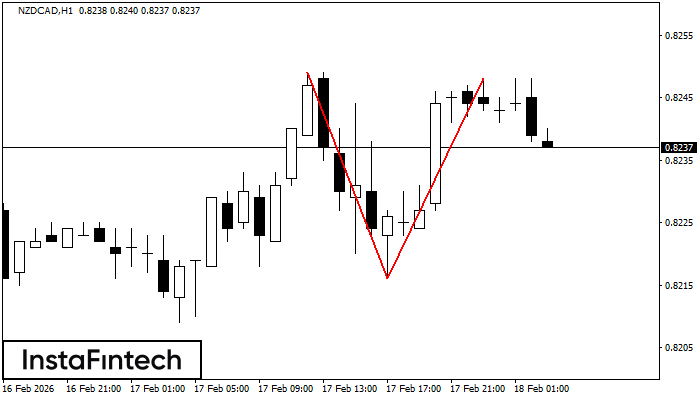
NZDCAD H1
Double Top
On the chart of NZDCAD H1 the Double Top reversal pattern has been formed. Characteristics: the upper boundary 0.8248; the lower boundary 0.8216; the width of the pattern 32 points. The signal: a break of the lower boundary will cause continuation of the downward trend targeting the 0.8176 level.
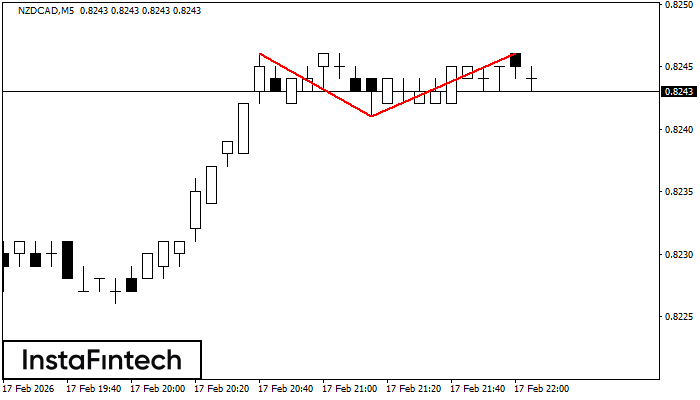
NZDCAD M5
Double Top
The Double Top reversal pattern has been formed on NZDCAD M5. Characteristics: the upper boundary 0.8246; the lower boundary 0.8241; the width of the pattern is 5 points. Sell trades are better to be opened below the lower boundary 0.8241 with a possible movements towards the 0.8226 level.
NZDCAD M5
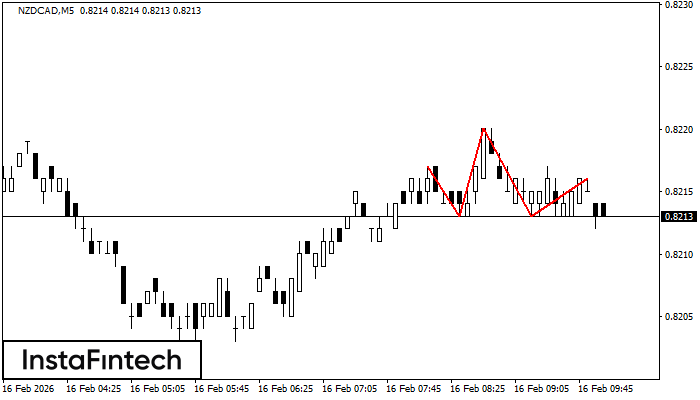
Head and Shoulders
The NZDCAD M5 formed the Head and Shoulders pattern with the following features: The Head’s top is at 0.8220, the Neckline and the upward angle are at 0.8213/0.8213. The formation of this pattern can bring about changes in the current trend from bullish to bearish. In case the pattern triggers the expected changes, the price of NZDCAD will go towards 0.8198.
NZDCAD M5
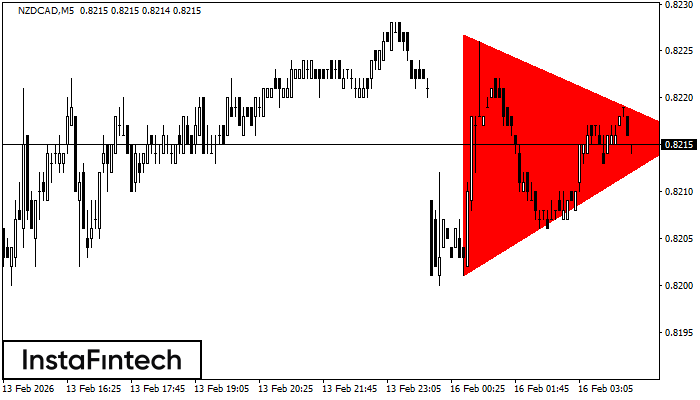
Bearish Symmetrical Triangle
According to the chart of M5, NZDCAD formed the Bearish Symmetrical Triangle pattern. Description: The lower border is 0.8201/0.8216 and upper border is 0.8227/0.8216. The pattern width is measured on the chart at -26 pips. The formation of the Bearish Symmetrical Triangle pattern evidently signals a continuation of the downward trend. In other words, if the scenario comes true and NZDCAD breaches the lower border, the price could continue its move toward 0.8201.