 Română
  Русский
 English
 Bahasa Indonesia
 Bahasa Malay
 ไทย
ไทย Español
 Deutsch
 Български
 Français
 Tiếng Việt
 中文
中文 বাংলা
বাংলা हिन्दी
 Čeština
 Українська
FX.co ★ Patterns #MSFT | Microsoft Corporation Stock Price

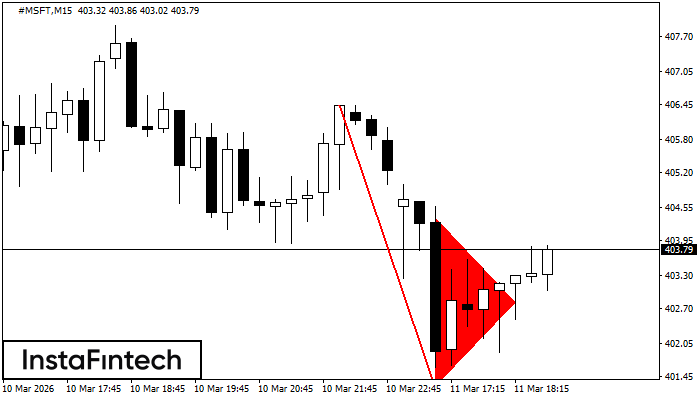
#MSFT M15
Bearish pennant
The Bearish pennant pattern has formed on the #MSFT M15 chart. The pattern signals continuation of the downtrend in case the pennant’s low of 401.26 is broken through. Recommendations: Place the sell stop pending order 10 pips below the pattern’s low. Place the take profit order at the projection distance of the flagpole height.
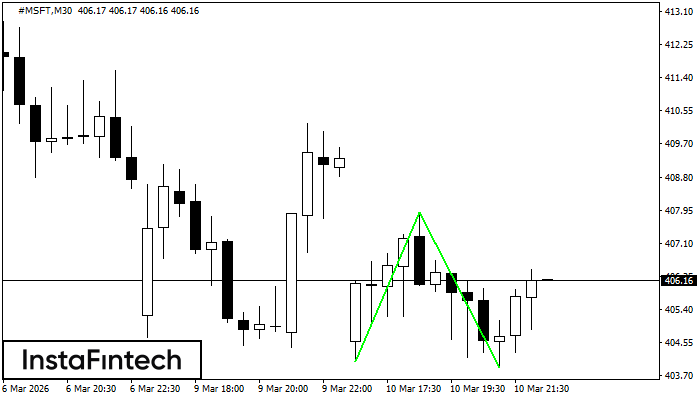
#MSFT M30
Double Bottom
The Double Bottom pattern has been formed on #MSFT M30. This formation signals a reversal of the trend from downwards to upwards. The signal is that a buy trade should be opened after the upper boundary of the pattern 407.90 is broken. The further movements will rely on the width of the current pattern 385 points.
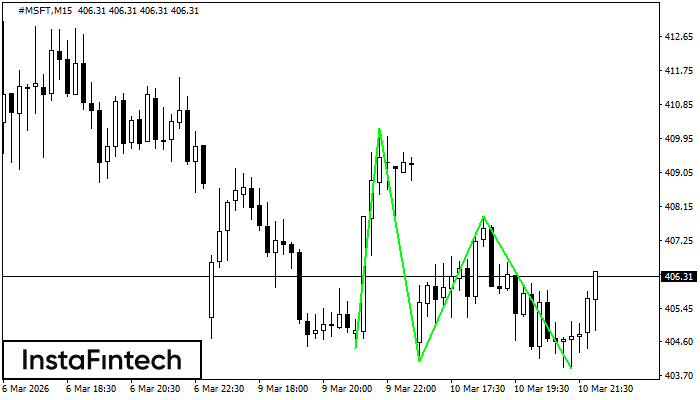
#MSFT M15
Triple Bottom
The Triple Bottom pattern has formed on the chart of the #MSFT M15 trading instrument. The pattern signals a change in the trend from downwards to upwards in the case of breakdown of 410.22/407.90.
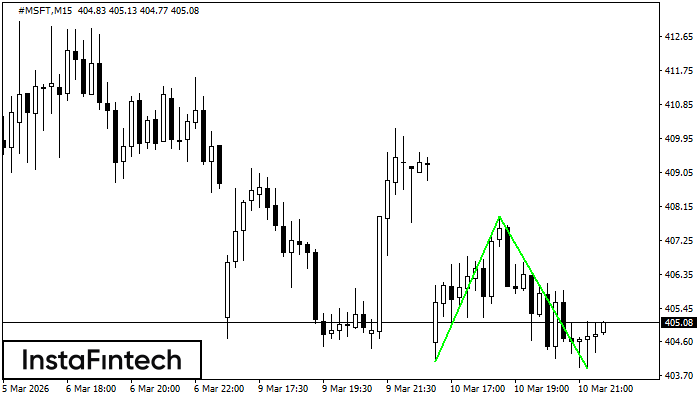
#MSFT M15
Double Bottom
The Double Bottom pattern has been formed on #MSFT M15. This formation signals a reversal of the trend from downwards to upwards. The signal is that a buy trade should be opened after the upper boundary of the pattern 407.90 is broken. The further movements will rely on the width of the current pattern 385 points.

#MSFT M5
Triple Bottom
The Triple Bottom pattern has been formed on #MSFT M5. It has the following characteristics: resistance level 409.15/405.98; support level 404.67/404.41; the width is 448 points. In the event of a breakdown of the resistance level of 409.15, the price is likely to continue an upward movement at least to 404.61.
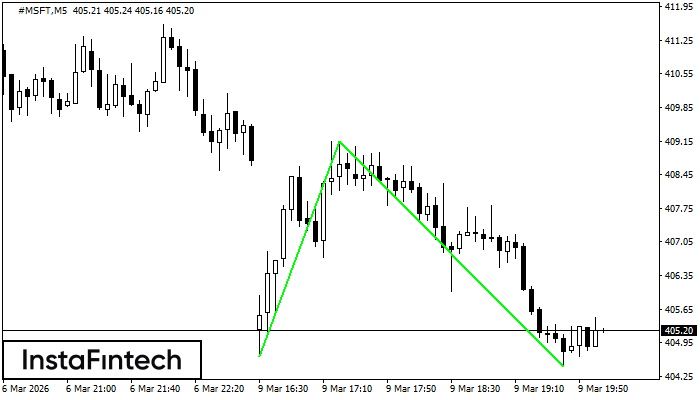
#MSFT M5
Double Bottom
The Double Bottom pattern has been formed on #MSFT M5. This formation signals a reversal of the trend from downwards to upwards. The signal is that a buy trade should be opened after the upper boundary of the pattern 409.15 is broken. The further movements will rely on the width of the current pattern 448 points.
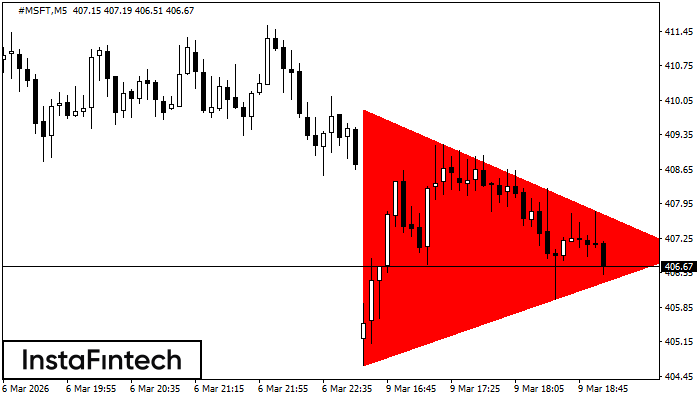
#MSFT M5
Bearish Symmetrical Triangle
According to the chart of M5, #MSFT formed the Bearish Symmetrical Triangle pattern. Trading recommendations: A breach of the lower border 404.67 is likely to encourage a continuation of the downward trend.

#MSFT M5
Bullish Symmetrical Triangle
According to the chart of M5, #MSFT formed the Bullish Symmetrical Triangle pattern. Description: This is the pattern of a trend continuation. 413.04 and 409.30 are the coordinates of the upper and lower borders respectively. The pattern width is measured on the chart at 374 pips. Outlook: If the upper border 413.04 is broken, the price is likely to continue its move by 411.16.
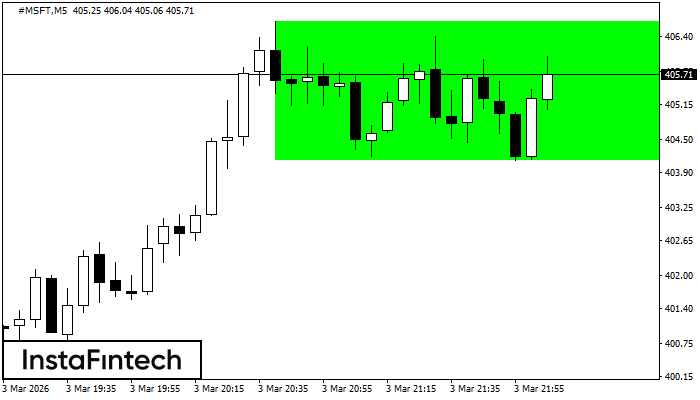
#MSFT M5
Bullish Rectangle
According to the chart of M5, #MSFT formed the Bullish Rectangle. This type of a pattern indicates a trend continuation. It consists of two levels: resistance 406.68 and support 404.12. In case the resistance level 406.68 - 406.68 is broken, the instrument is likely to follow the bullish trend.
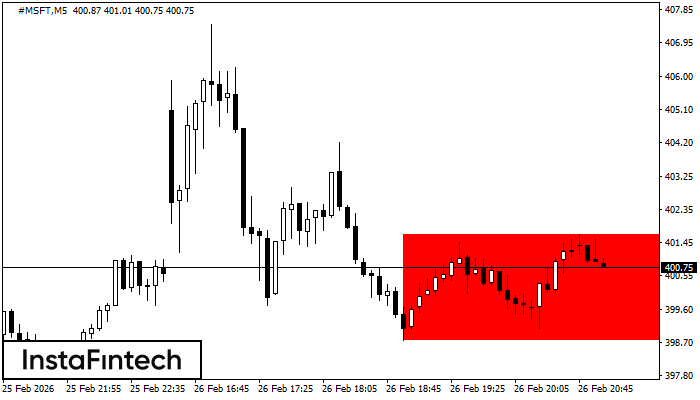
#MSFT M5
Bearish Rectangle
According to the chart of M5, #MSFT formed the Bearish Rectangle which is a pattern of a trend continuation. The pattern is contained within the following borders: lower border 398.75 – 398.75 and upper border 401.66 – 401.66. In case the lower border is broken, the instrument is likely to follow the downward trend.