 Română
  Русский
 English
 Bahasa Indonesia
 Bahasa Malay
 ไทย
ไทย Español
 Deutsch
 Български
 Français
 Tiếng Việt
 中文
中文 বাংলা
বাংলা हिन्दी
 Čeština
 Українська
FX.co ★ Patterns #GOOG | Alphabet Inc. Stock Price

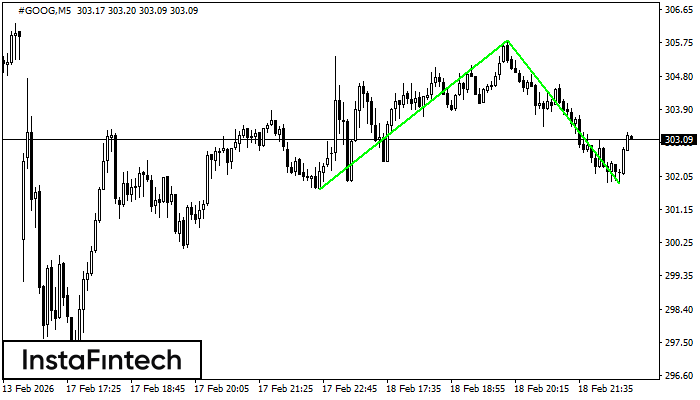
#GOOG M5
Double Bottom
The Double Bottom pattern has been formed on #GOOG M5. Characteristics: the support level 301.71; the resistance level 305.80; the width of the pattern 409 points. If the resistance level is broken, a change in the trend can be predicted with the first target point lying at the distance of 393 points.
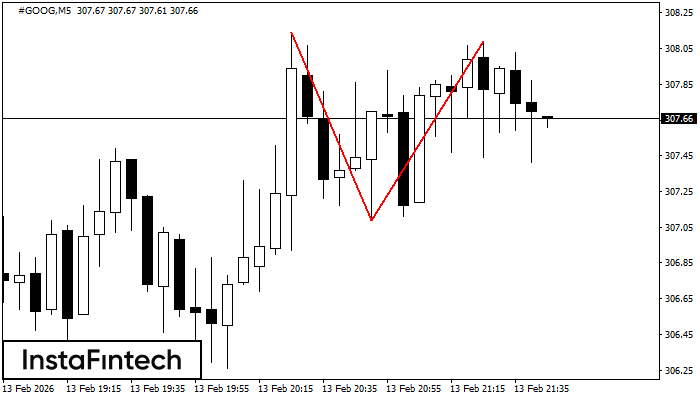
#GOOG M5
Double Top
The Double Top reversal pattern has been formed on #GOOG M5. Characteristics: the upper boundary 308.14; the lower boundary 307.09; the width of the pattern is 100 points. Sell trades are better to be opened below the lower boundary 307.09 with a possible movements towards the 306.94 level.
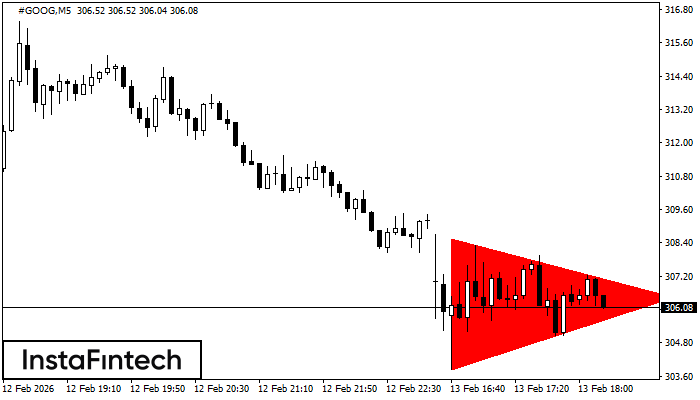
#GOOG M5
Bearish Symmetrical Triangle
According to the chart of M5, #GOOG formed the Bearish Symmetrical Triangle pattern. Trading recommendations: A breach of the lower border 303.83 is likely to encourage a continuation of the downward trend.
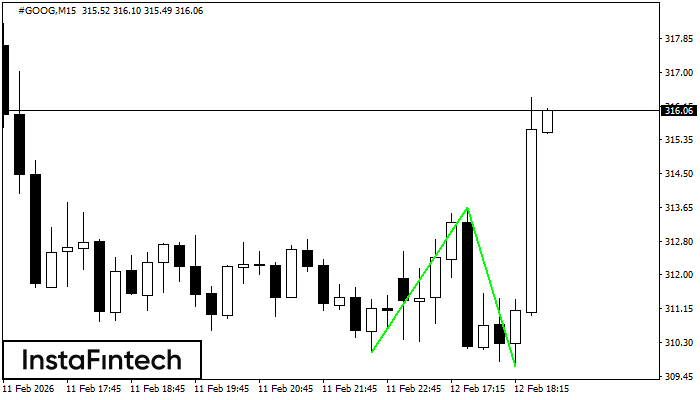
#GOOG M15
Double Bottom
The Double Bottom pattern has been formed on #GOOG M15. This formation signals a reversal of the trend from downwards to upwards. The signal is that a buy trade should be opened after the upper boundary of the pattern 313.65 is broken. The further movements will rely on the width of the current pattern 360 points.
#GOOG M15
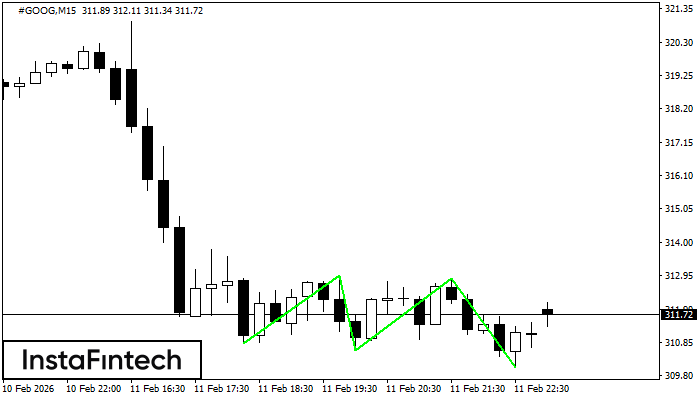
Triple Bottom
The Triple Bottom pattern has been formed on #GOOG M15. It has the following characteristics: resistance level 312.97/312.85; support level 310.83/310.05; the width is 214 points. In the event of a breakdown of the resistance level of 312.97, the price is likely to continue an upward movement at least to 310.83.
#GOOG M15
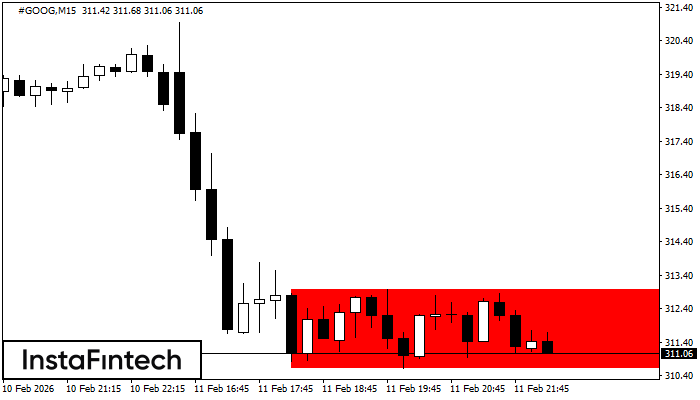
Bearish Rectangle
According to the chart of M15, #GOOG formed the Bearish Rectangle. This type of a pattern indicates a trend continuation. It consists of two levels: resistance 312.97 - 0.00 and support 310.61 – 310.61. In case the resistance level 310.61 - 310.61 is broken, the instrument is likely to follow the bearish trend.
#GOOG M5
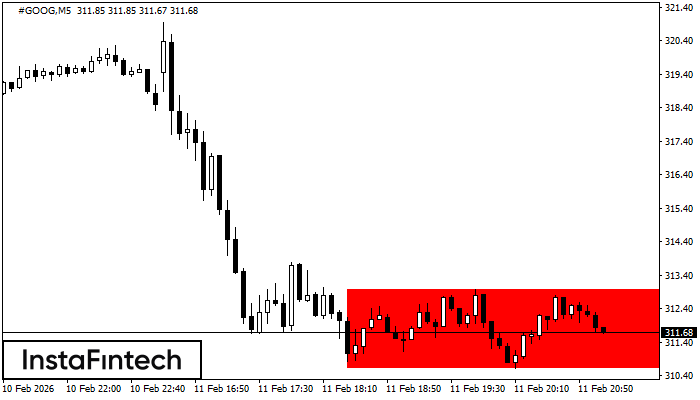
Bearish Rectangle
According to the chart of M5, #GOOG formed the Bearish Rectangle. This type of a pattern indicates a trend continuation. It consists of two levels: resistance 312.97 - 0.00 and support 310.61 – 310.61. In case the resistance level 310.61 - 310.61 is broken, the instrument is likely to follow the bearish trend.
#GOOG M5
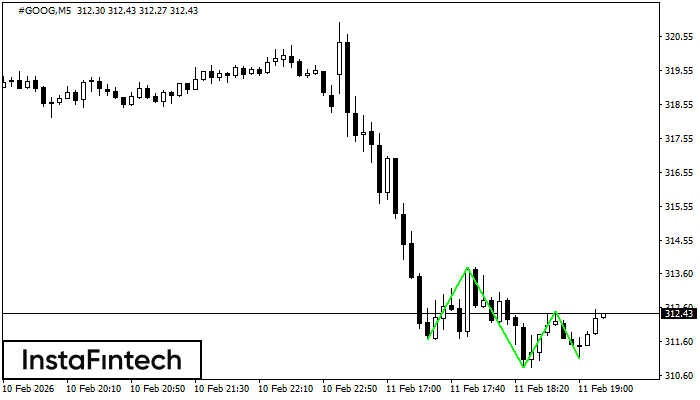
Triple Bottom
The Triple Bottom pattern has formed on the chart of the #GOOG M5 trading instrument. The pattern signals a change in the trend from downwards to upwards in the case of breakdown of 313.77/312.47.
#GOOG M5
Double Top
On the chart of #GOOG M5 the Double Top reversal pattern has been formed. Characteristics: the upper boundary 344.87; the lower boundary 343.62; the width of the pattern 125 points. The signal: a break of the lower boundary will cause continuation of the downward trend targeting the 343.47 level.
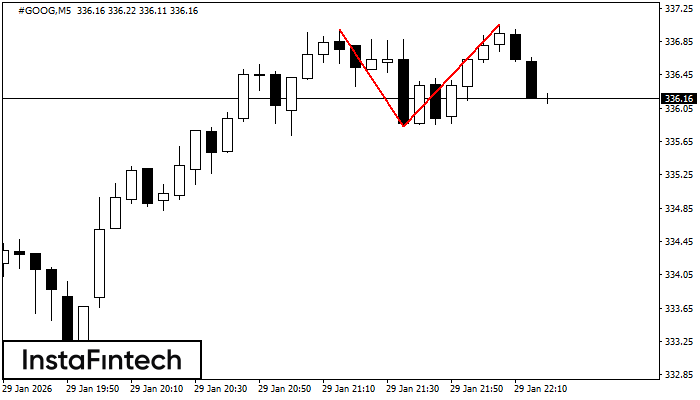
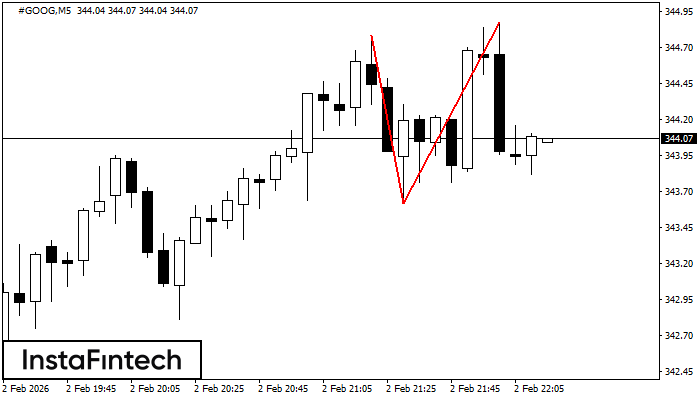
#GOOG M5
Double Top
On the chart of #GOOG M5 the Double Top reversal pattern has been formed. Characteristics: the upper boundary 337.05; the lower boundary 335.83; the width of the pattern 122 points. The signal: a break of the lower boundary will cause continuation of the downward trend targeting the 335.68 level.