 Română
  Русский
 English
 Bahasa Indonesia
 Bahasa Malay
 ไทย
ไทย Español
 Deutsch
 Български
 Français
 Tiếng Việt
 中文
中文 বাংলা
বাংলা हिन्दी
 Čeština
 Українська
FX.co ★ Patterns GBPAUD | British Pound (GBP) to Australian Dollar (AUD) Rate in the Forex market

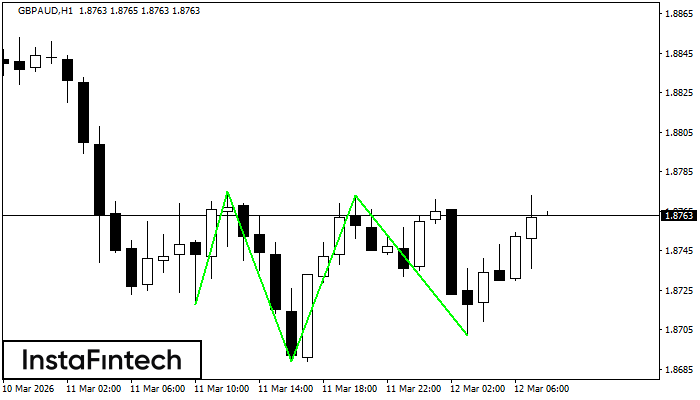
GBPAUD H1
Triple Bottom
The Triple Bottom pattern has formed on the chart of the GBPAUD H1 trading instrument. The pattern signals a change in the trend from downwards to upwards in the case of breakdown of 1.8775/1.8773.
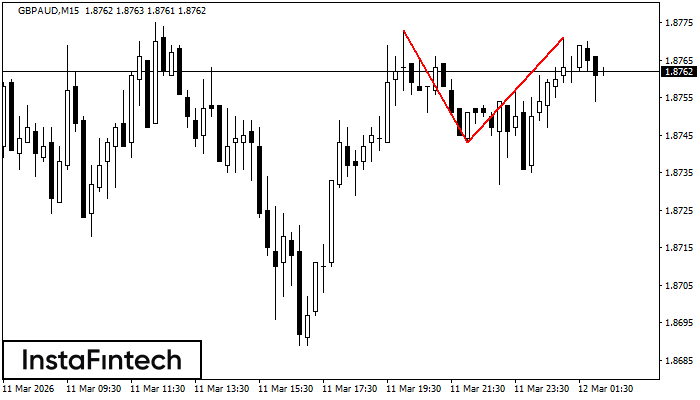
GBPAUD M15
Double Top
The Double Top pattern has been formed on GBPAUD M15. It signals that the trend has been changed from upwards to downwards. Probably, if the base of the pattern 1.8743 is broken, the downward movement will continue.
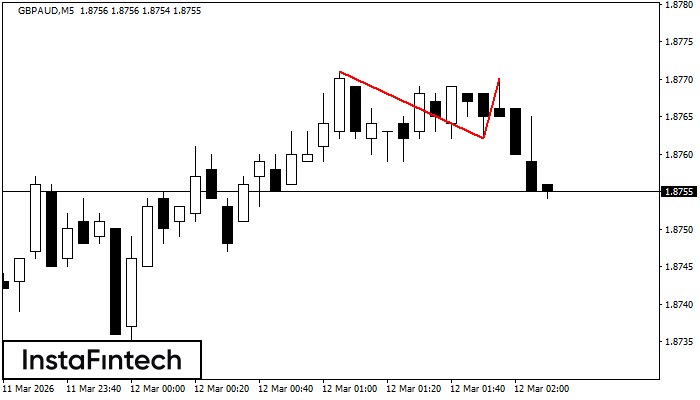
GBPAUD M5
Double Top
The Double Top reversal pattern has been formed on GBPAUD M5. Characteristics: the upper boundary 1.8771; the lower boundary 1.8762; the width of the pattern is 8 points. Sell trades are better to be opened below the lower boundary 1.8762 with a possible movements towards the 1.8747 level.
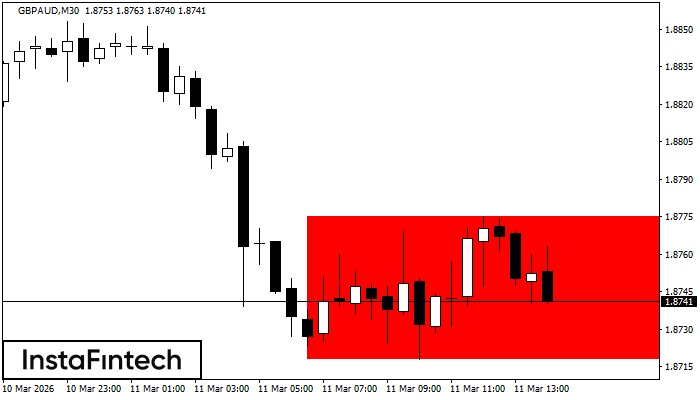
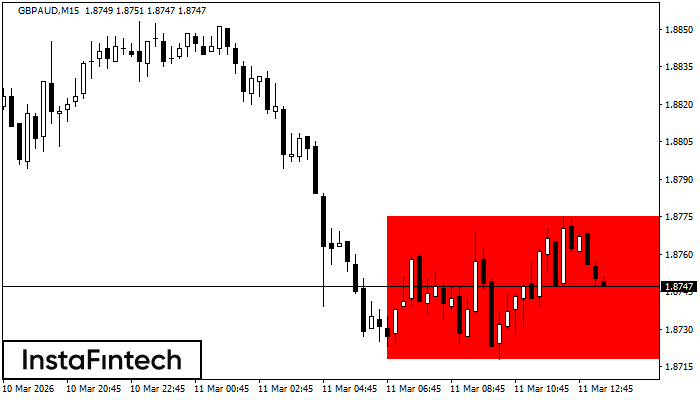
GBPAUD M30
Bearish Rectangle
According to the chart of M30, GBPAUD formed the Bearish Rectangle. This type of a pattern indicates a trend continuation. It consists of two levels: resistance 1.8775 - 0.0000 and support 1.8718 – 1.8718. In case the resistance level 1.8718 - 1.8718 is broken, the instrument is likely to follow the bearish trend.
GBPAUD M15
Bearish Rectangle
According to the chart of M15, GBPAUD formed the Bearish Rectangle. The pattern indicates a trend continuation. The upper border is 1.8775, the lower border is 1.8718. The signal means that a short position should be opened after fixing a price below the lower border 1.8718 of the Bearish Rectangle.
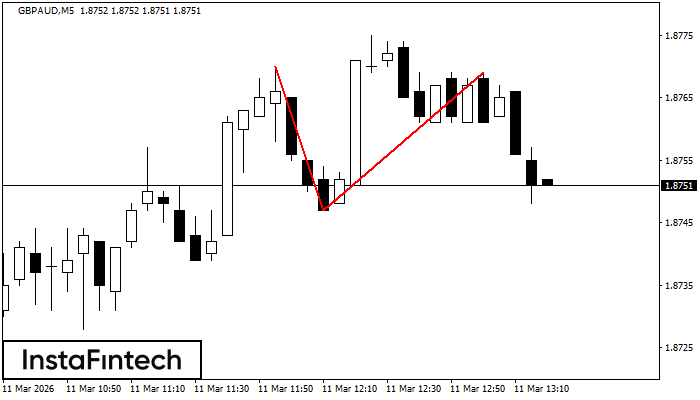
GBPAUD M5
Double Top
The Double Top reversal pattern has been formed on GBPAUD M5. Characteristics: the upper boundary 1.8770; the lower boundary 1.8747; the width of the pattern is 22 points. Sell trades are better to be opened below the lower boundary 1.8747 with a possible movements towards the 1.8732 level.
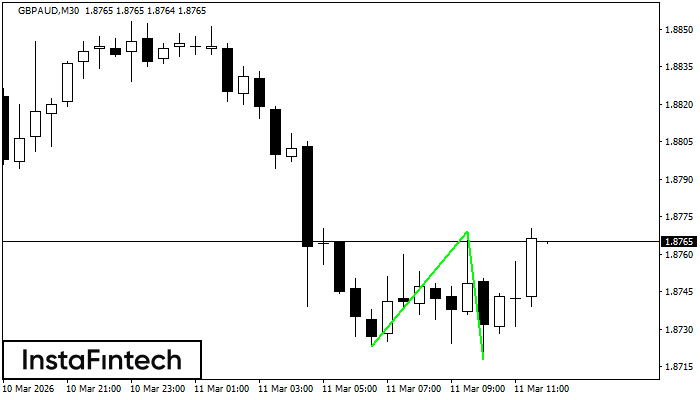
GBPAUD M30
Double Bottom
The Double Bottom pattern has been formed on GBPAUD M30; the upper boundary is 1.8769; the lower boundary is 1.8718. The width of the pattern is 46 points. In case of a break of the upper boundary 1.8769, a change in the trend can be predicted where the width of the pattern will coincide with the distance to a possible take profit level.
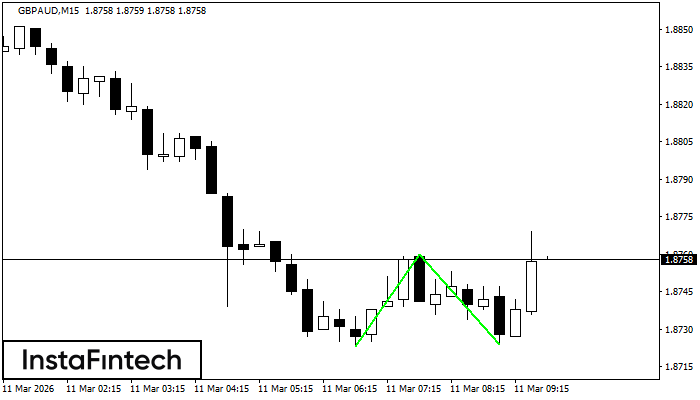
GBPAUD M15
Double Bottom
The Double Bottom pattern has been formed on GBPAUD M15. This formation signals a reversal of the trend from downwards to upwards. The signal is that a buy trade should be opened after the upper boundary of the pattern 1.8760 is broken. The further movements will rely on the width of the current pattern 37 points.
GBPAUD M5
Double Top
The Double Top reversal pattern has been formed on GBPAUD M5. Characteristics: the upper boundary 1.8845; the lower boundary 1.8803; the width of the pattern is 44 points. Sell trades are better to be opened below the lower boundary 1.8803 with a possible movements towards the 1.8788 level.

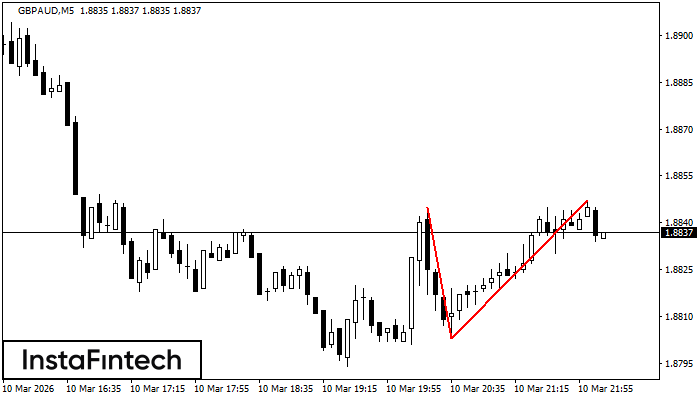
GBPAUD M5
Triple Bottom
The Triple Bottom pattern has been formed on GBPAUD M5. It has the following characteristics: resistance level 1.8841/1.8838; support level 1.8818/1.8815; the width is 23 points. In the event of a breakdown of the resistance level of 1.8841, the price is likely to continue an upward movement at least to 1.8833.