 Română
  Русский
 English
 Bahasa Indonesia
 Bahasa Malay
 ไทย
ไทย Español
 Deutsch
 Български
 Français
 Tiếng Việt
 中文
中文 বাংলা
বাংলা हिन्दी
 Čeština
 Українська
FX.co ★ Patterns EURUSD | Euro (EUR) to US Dollar (USD) Rate in the Forex market

EURUSD M5
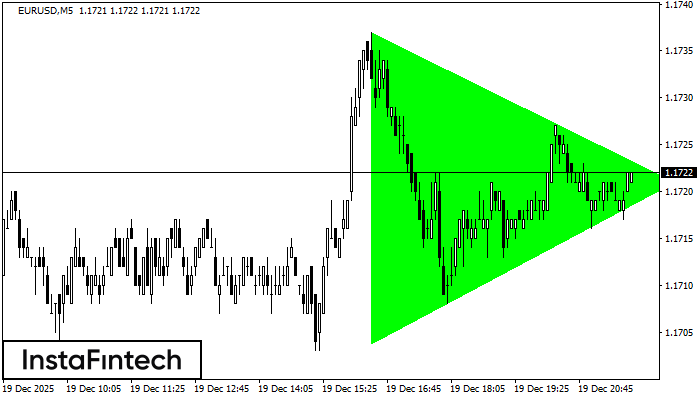
Bullish Symmetrical Triangle
According to the chart of M5, EURUSD formed the Bullish Symmetrical Triangle pattern. Description: This is the pattern of a trend continuation. 1.1737 and 1.1704 are the coordinates of the upper and lower borders respectively. The pattern width is measured on the chart at 33 pips. Outlook: If the upper border 1.1737 is broken, the price is likely to continue its move by 1.1736.
EURUSD M5
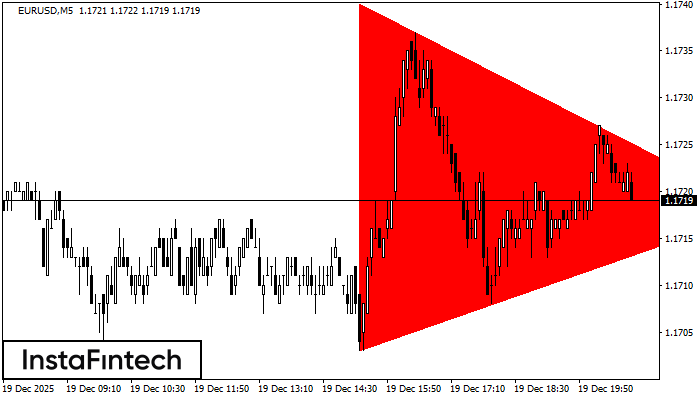
Bearish Symmetrical Triangle
According to the chart of M5, EURUSD formed the Bearish Symmetrical Triangle pattern. This pattern signals a further downward trend in case the lower border 1.1703 is breached. Here, a hypothetical profit will equal the width of the available pattern that is -37 pips.
EURUSD M30
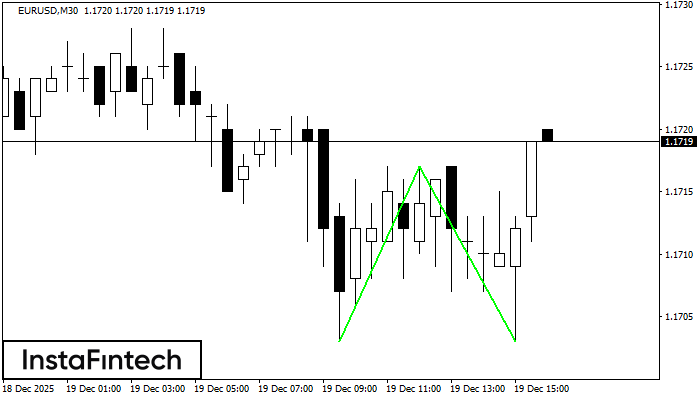
Double Bottom
The Double Bottom pattern has been formed on EURUSD M30. This formation signals a reversal of the trend from downwards to upwards. The signal is that a buy trade should be opened after the upper boundary of the pattern 1.1717 is broken. The further movements will rely on the width of the current pattern 14 points.
EURUSD M30
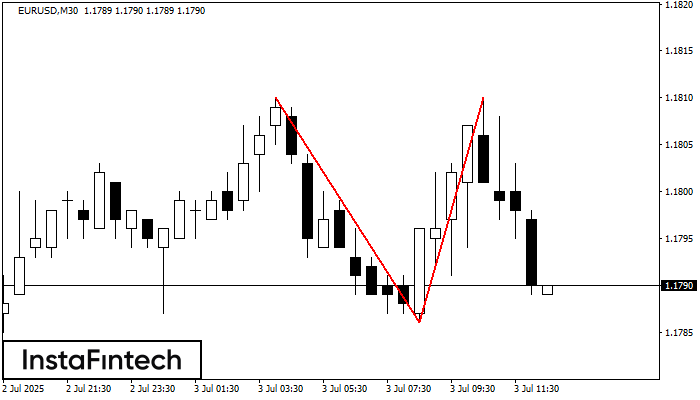
Double Top
The Double Top reversal pattern has been formed on EURUSD M30. Characteristics: the upper boundary 1.1810; the lower boundary 1.1786; the width of the pattern is 24 points. Sell trades are better to be opened below the lower boundary 1.1786 with a possible movements towards the 1.1756 level.
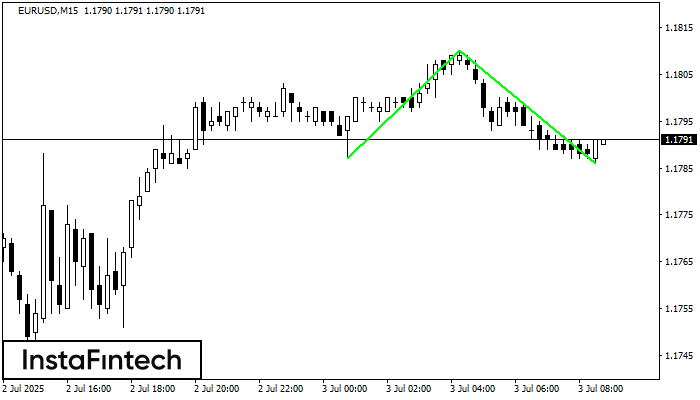
EURUSD M15
Double Bottom
The Double Bottom pattern has been formed on EURUSD M15. This formation signals a reversal of the trend from downwards to upwards. The signal is that a buy trade should be opened after the upper boundary of the pattern 1.1810 is broken. The further movements will rely on the width of the current pattern 23 points.
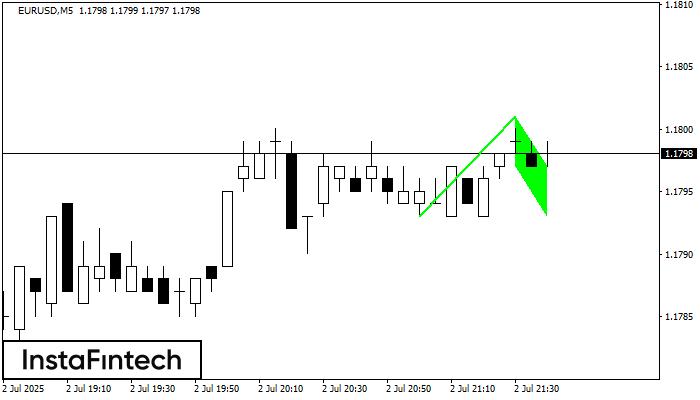
EURUSD M5
Bullish Flag
The Bullish Flag pattern has been formed on the chart EURUSD M5 which signals that the upward trend will continue. Signals: а break of the peak at 1.1801 may push the price higher, and the rise will be the projection of the pole.
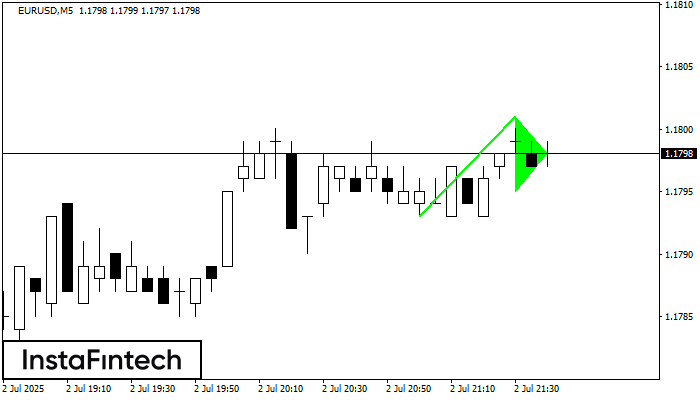
EURUSD M5
Bullish pennant
The Bullish pennant graphic pattern has formed on the EURUSD M5 instrument. This pattern type falls under the category of continuation patterns. In this case, if the quote can breaks out high, is expected to continue the upward trend to level 1.1816.
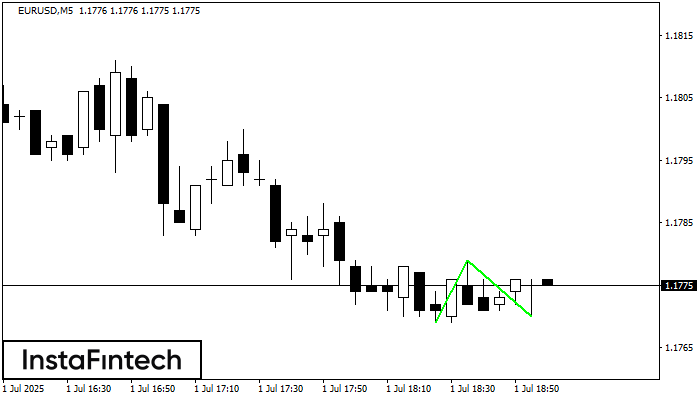
EURUSD M5
Double Bottom
The Double Bottom pattern has been formed on EURUSD M5. Characteristics: the support level 1.1769; the resistance level 1.1779; the width of the pattern 10 points. If the resistance level is broken, a change in the trend can be predicted with the first target point lying at the distance of 9 points.
EURUSD M5
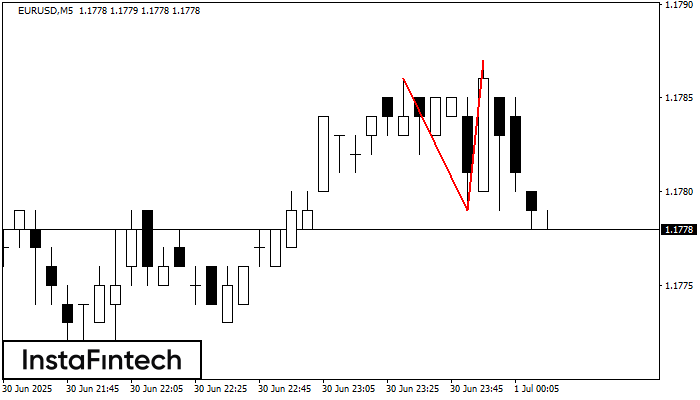
Double Top
The Double Top pattern has been formed on EURUSD M5. It signals that the trend has been changed from upwards to downwards. Probably, if the base of the pattern 1.1779 is broken, the downward movement will continue.
EURUSD M5
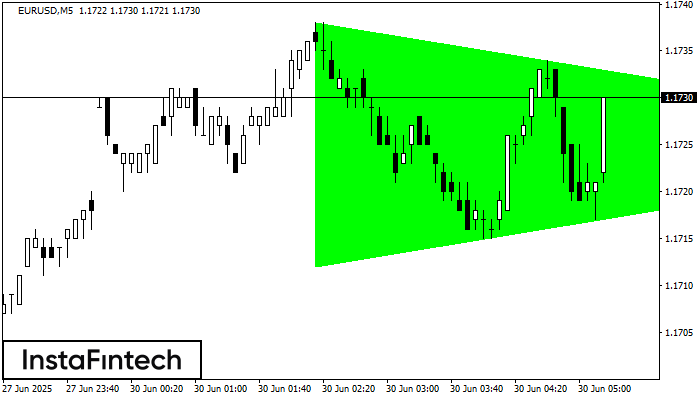
Bullish Symmetrical Triangle
According to the chart of M5, EURUSD formed the Bullish Symmetrical Triangle pattern. Description: This is the pattern of a trend continuation. 1.1738 and 1.1712 are the coordinates of the upper and lower borders respectively. The pattern width is measured on the chart at 26 pips. Outlook: If the upper border 1.1738 is broken, the price is likely to continue its move by 1.1740.