 Română
  Русский
 English
 Bahasa Indonesia
 Bahasa Malay
 ไทย
ไทย Español
 Deutsch
 Български
 Français
 Tiếng Việt
 中文
中文 বাংলা
বাংলা हिन्दी
 Čeština
 Українська
FX.co ★ Patterns EURNZD | Euro (EUR) to New Zealand Dollar (NZD) Rate in the Forex market

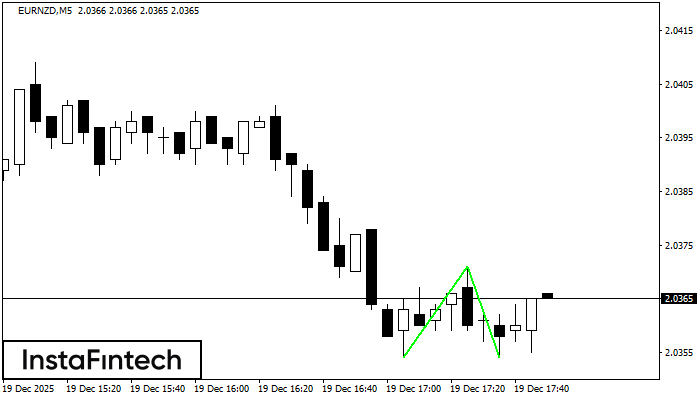
EURNZD M5
Double Bottom
The Double Bottom pattern has been formed on EURNZD M5. This formation signals a reversal of the trend from downwards to upwards. The signal is that a buy trade should be opened after the upper boundary of the pattern 2.0340 is broken. The further movements will rely on the width of the current pattern 12 points.
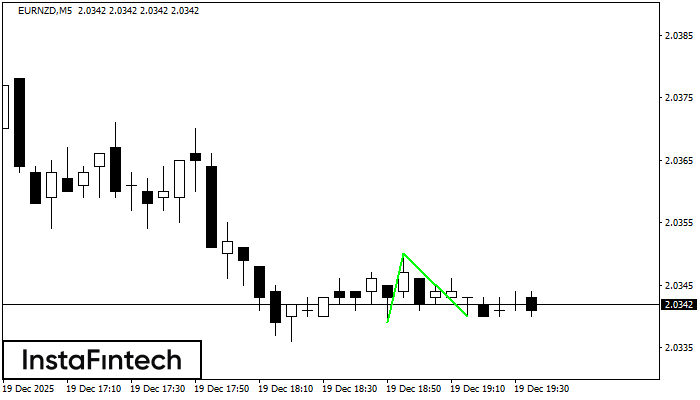
EURNZD M5
Double Bottom
The Double Bottom pattern has been formed on EURNZD M5; the upper boundary is 2.0350; the lower boundary is 2.0340. The width of the pattern is 11 points. In case of a break of the upper boundary 2.0350, a change in the trend can be predicted where the width of the pattern will coincide with the distance to a possible take profit level.
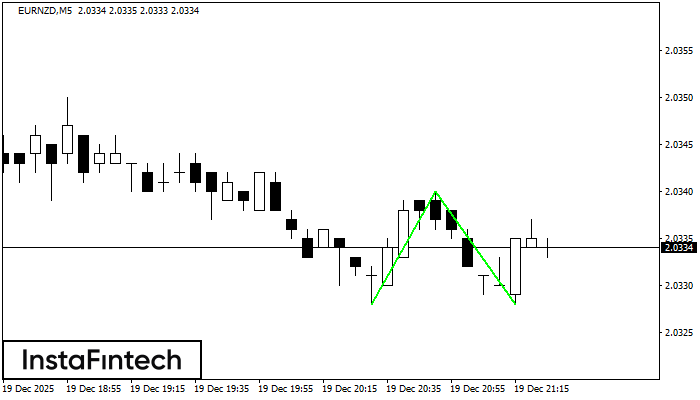
EURNZD M5
Double Bottom
The Double Bottom pattern has been formed on EURNZD M5. This formation signals a reversal of the trend from downwards to upwards. The signal is that a buy trade should be opened after the upper boundary of the pattern 2.0371 is broken. The further movements will rely on the width of the current pattern 17 points.
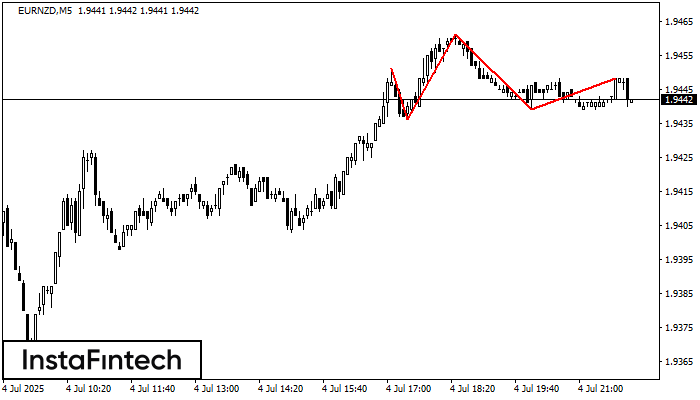
EURNZD M5
Head and Shoulders
According to the chart of M5, EURNZD formed the Head and Shoulders pattern. The Head’s top is set at 1.9461 while the median line of the Neck is found at 1.9436/1.9439. The formation of the Head and Shoulders pattern evidently signals a reversal of the upward trend. In other words, in case the scenario comes true, the price of EURNZD will go towards 1.9424.
EURNZD M5
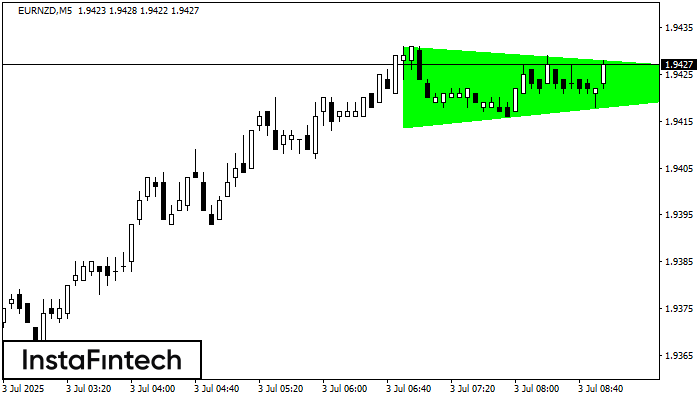
Bullish Symmetrical Triangle
According to the chart of M5, EURNZD formed the Bullish Symmetrical Triangle pattern. The lower border of the pattern touches the coordinates 1.9414/1.9424 whereas the upper border goes across 1.9431/1.9424. If the Bullish Symmetrical Triangle pattern is in progress, this evidently signals a further upward trend. In other words, in case the scenario comes true, the price of EURNZD will breach the upper border to head for 1.9439.
EURNZD M5
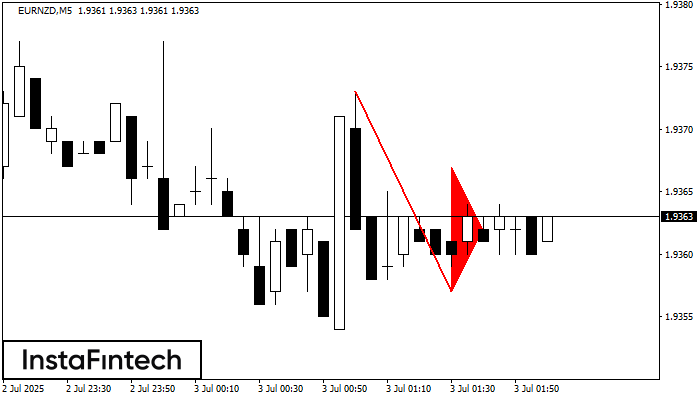
Bearish pennant
The Bearish pennant pattern has formed on the EURNZD M5 chart. The pattern signals continuation of the downtrend in case the pennant’s low of 1.9357 is broken through. Recommendations: Place the sell stop pending order 10 pips below the pattern’s low. Place the take profit order at the projection distance of the flagpole height.
EURNZD M5
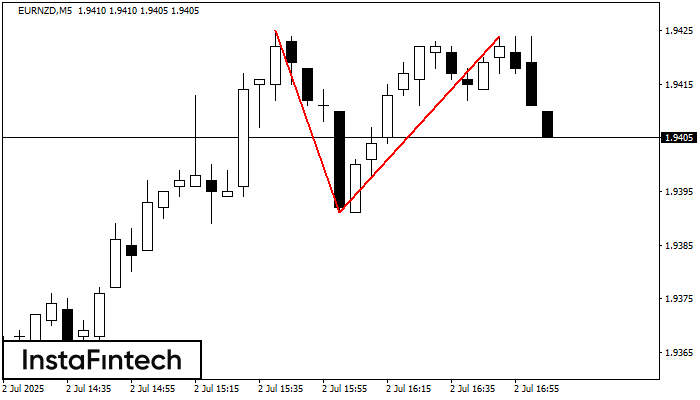
Double Top
The Double Top pattern has been formed on EURNZD M5. It signals that the trend has been changed from upwards to downwards. Probably, if the base of the pattern 1.9391 is broken, the downward movement will continue.
EURNZD M5
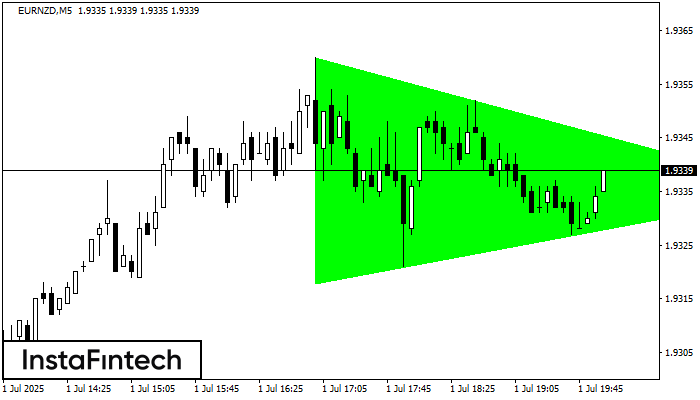
Bullish Symmetrical Triangle
According to the chart of M5, EURNZD formed the Bullish Symmetrical Triangle pattern. The lower border of the pattern touches the coordinates 1.9318/1.9335 whereas the upper border goes across 1.9360/1.9335. If the Bullish Symmetrical Triangle pattern is in progress, this evidently signals a further upward trend. In other words, in case the scenario comes true, the price of EURNZD will breach the upper border to head for 1.9350.

EURNZD M5
Double Bottom
The Double Bottom pattern has been formed on EURNZD M5; the upper boundary is 1.9334; the lower boundary is 1.9307. The width of the pattern is 26 points. In case of a break of the upper boundary 1.9334, a change in the trend can be predicted where the width of the pattern will coincide with the distance to a possible take profit level.
EURNZD M5
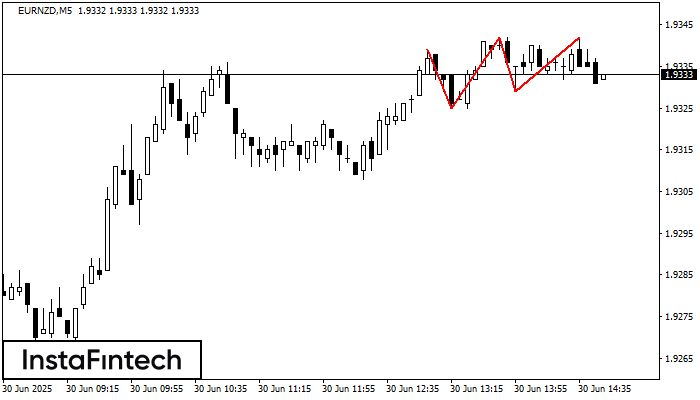
Triple Top
On the chart of the EURNZD M5 trading instrument, the Triple Top pattern that signals a trend change has formed. It is possible that after formation of the third peak, the price will try to break through the resistance level 1.9325, where we advise to open a trading position for sale. Take profit is the projection of the pattern’s width, which is 14 points.