 Română
  Русский
 English
 Bahasa Indonesia
 Bahasa Malay
 ไทย
ไทย Español
 Deutsch
 Български
 Français
 Tiếng Việt
 中文
中文 বাংলা
বাংলা हिन्दी
 Čeština
 Українська
FX.co ★ Patterns EURCHF | Euro (EUR) to Swiss Franc (CHF) Rate in the Forex market

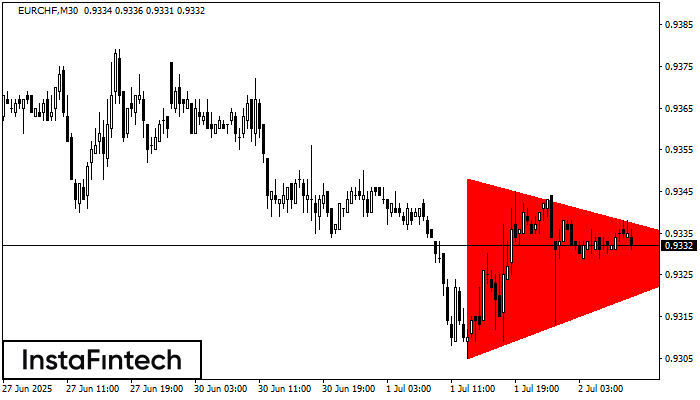
EURCHF M30
Bearish Symmetrical Triangle
According to the chart of M30, EURCHF formed the Bearish Symmetrical Triangle pattern. This pattern signals a further downward trend in case the lower border 0.9305 is breached. Here, a hypothetical profit will equal the width of the available pattern that is -43 pips.
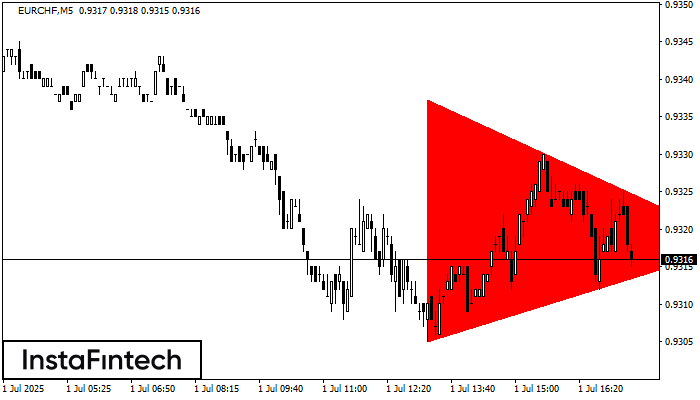
EURCHF M5
Bearish Symmetrical Triangle
According to the chart of M5, EURCHF formed the Bearish Symmetrical Triangle pattern. Description: The lower border is 0.9305/0.9318 and upper border is 0.9337/0.9318. The pattern width is measured on the chart at -32 pips. The formation of the Bearish Symmetrical Triangle pattern evidently signals a continuation of the downward trend. In other words, if the scenario comes true and EURCHF breaches the lower border, the price could continue its move toward 0.9303.
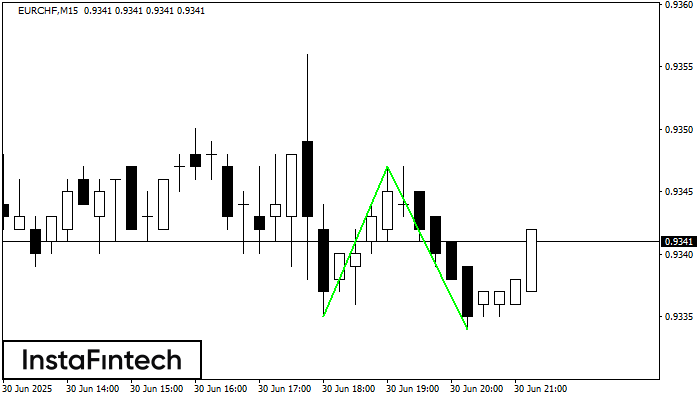
EURCHF M15
Double Bottom
The Double Bottom pattern has been formed on EURCHF M15. This formation signals a reversal of the trend from downwards to upwards. The signal is that a buy trade should be opened after the upper boundary of the pattern 0.9347 is broken. The further movements will rely on the width of the current pattern 12 points.

EURCHF M5
Triple Bottom
The Triple Bottom pattern has formed on the chart of the EURCHF M5 trading instrument. The pattern signals a change in the trend from downwards to upwards in the case of breakdown of 0.9347/0.9337.
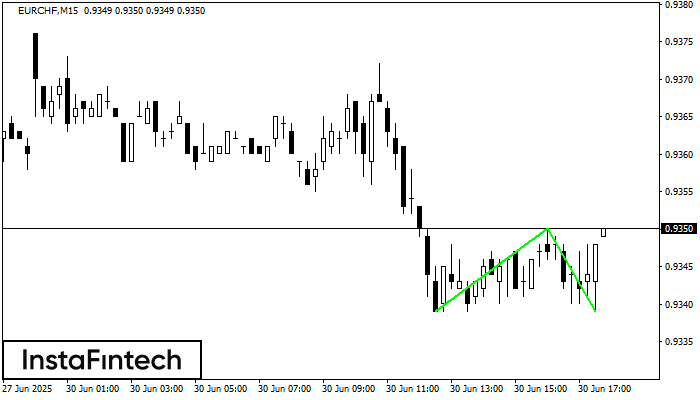
EURCHF M15
Double Bottom
The Double Bottom pattern has been formed on EURCHF M15. This formation signals a reversal of the trend from downwards to upwards. The signal is that a buy trade should be opened after the upper boundary of the pattern 0.9350 is broken. The further movements will rely on the width of the current pattern 11 points.
EURCHF M5
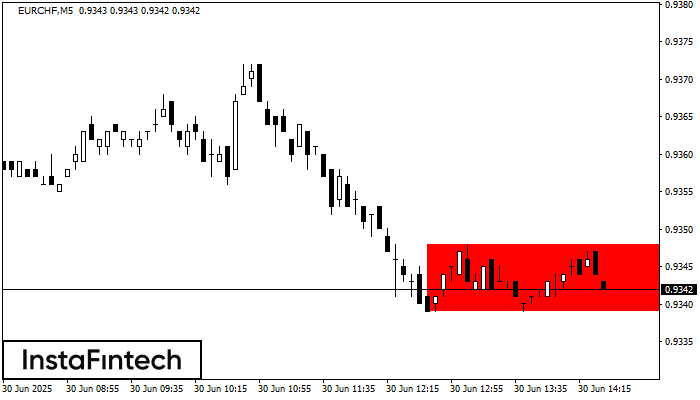
Bearish Rectangle
According to the chart of M5, EURCHF formed the Bearish Rectangle which is a pattern of a trend continuation. The pattern is contained within the following borders: lower border 0.9339 – 0.9339 and upper border 0.9348 – 0.9348. In case the lower border is broken, the instrument is likely to follow the downward trend.
EURCHF M5
Double Bottom
The Double Bottom pattern has been formed on EURCHF M5. This formation signals a reversal of the trend from downwards to upwards. The signal is that a buy trade should be opened after the upper boundary of the pattern 0.9389 is broken. The further movements will rely on the width of the current pattern 11 points.
EURCHF M5
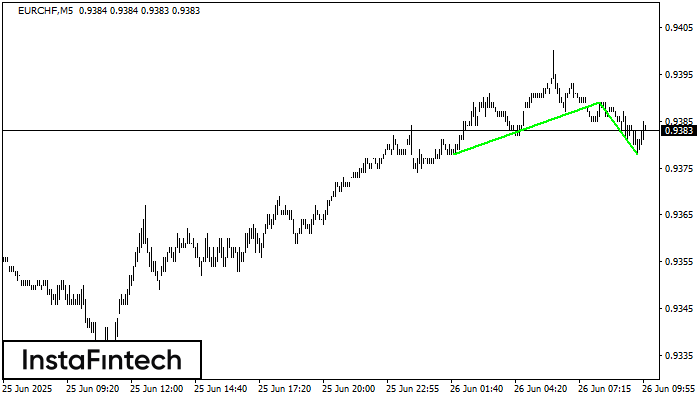
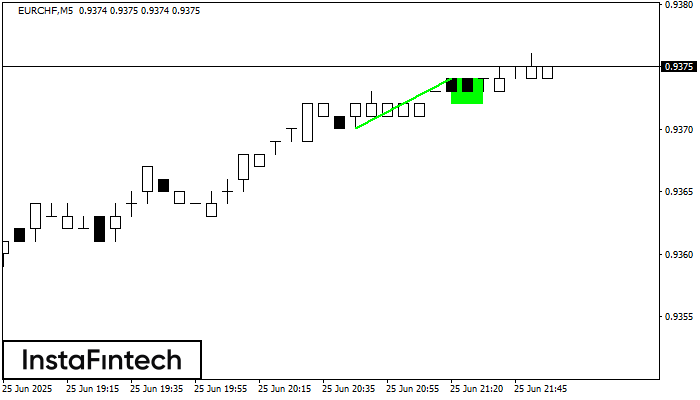
Bullish Flag
The Bullish Flag pattern has been formed on EURCHF at M5. The lower boundary of the pattern is located at 0.9372/0.9372, while the higher boundary lies at 0.9374/0.9374. The projection of the flagpole is 4 points. This formation signals that the upward trend is most likely to continue. Therefore, if the level of 0.9374 is broken, the price will move further upwards.
EURCHF M5
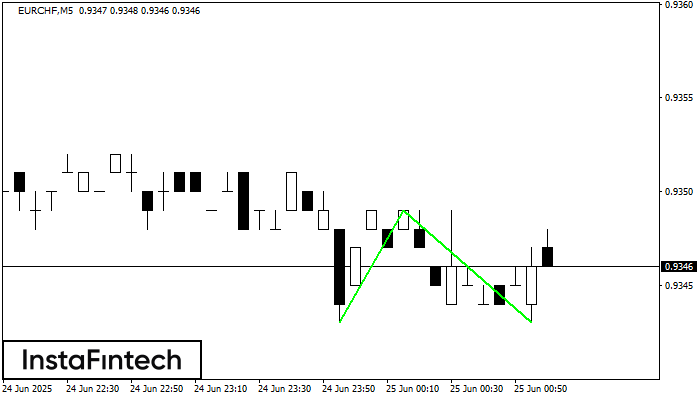
Double Bottom
The Double Bottom pattern has been formed on EURCHF M5. Characteristics: the support level 0.9343; the resistance level 0.9349; the width of the pattern 6 points. If the resistance level is broken, a change in the trend can be predicted with the first target point lying at the distance of 6 points.
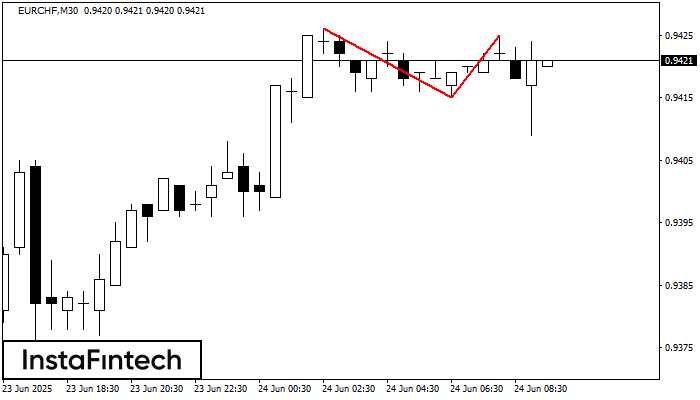
EURCHF M30
Double Top
The Double Top reversal pattern has been formed on EURCHF M30. Characteristics: the upper boundary 0.9426; the lower boundary 0.9415; the width of the pattern is 10 points. Sell trades are better to be opened below the lower boundary 0.9415 with a possible movements towards the 0.9385 level.