 Română
  Русский
 English
 Bahasa Indonesia
 Bahasa Malay
 ไทย
ไทย Español
 Deutsch
 Български
 Français
 Tiếng Việt
 中文
中文 বাংলা
বাংলা हिन्दी
 Čeština
 Українська
FX.co ★ Patterns #EBAY | eBay Inc. Stock Price

#EBAY M5
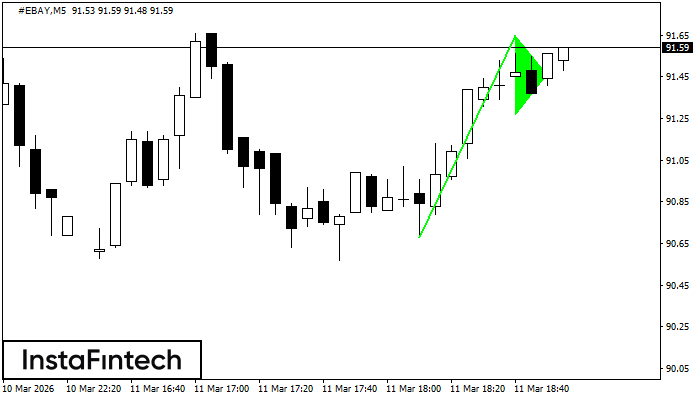
Bullish pennant
The Bullish pennant signal – Trading instrument #EBAY M5, continuation pattern. Forecast: it is possible to set up a buy position above the pattern’s high of 91.65, with the prospect of the next move being a projection of the flagpole height.
#EBAY M5
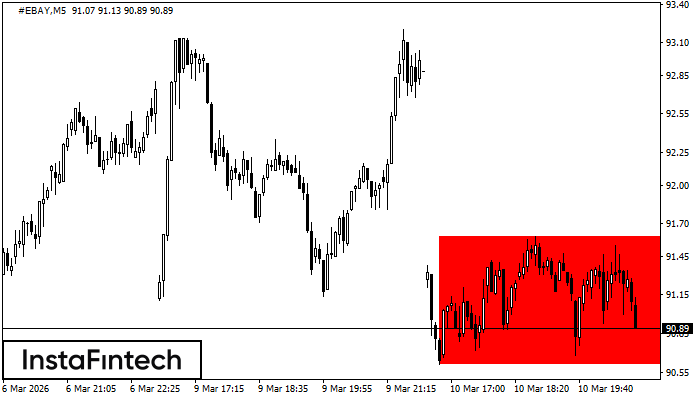
Bearish Rectangle
According to the chart of M5, #EBAY formed the Bearish Rectangle which is a pattern of a trend continuation. The pattern is contained within the following borders: lower border 90.61 – 90.61 and upper border 91.60 – 91.60. In case the lower border is broken, the instrument is likely to follow the downward trend.
#EBAY M5
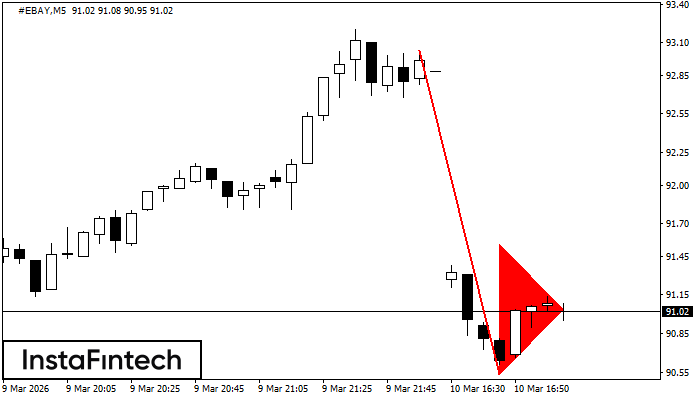
Bearish pennant
The Bearish pennant pattern has formed on the #EBAY M5 chart. The pattern signals continuation of the downtrend in case the pennant’s low of 90.54 is broken through. Recommendations: Place the sell stop pending order 10 pips below the pattern’s low. Place the take profit order at the projection distance of the flagpole height.
#EBAY M5
Double Bottom
The Double Bottom pattern has been formed on #EBAY M5. This formation signals a reversal of the trend from downwards to upwards. The signal is that a buy trade should be opened after the upper boundary of the pattern 92.16 is broken. The further movements will rely on the width of the current pattern 147 points.
#EBAY M5
Double Bottom
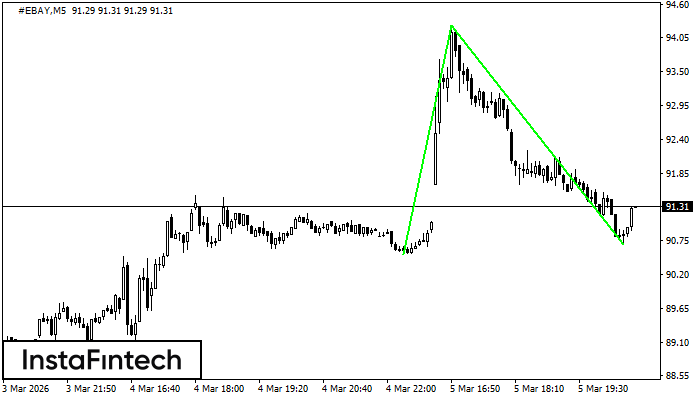
The Double Bottom pattern has been formed on #EBAY M5. This formation signals a reversal of the trend from downwards to upwards. The signal is that a buy trade should be opened after the upper boundary of the pattern 94.25 is broken. The further movements will rely on the width of the current pattern 373 points.
#EBAY M5
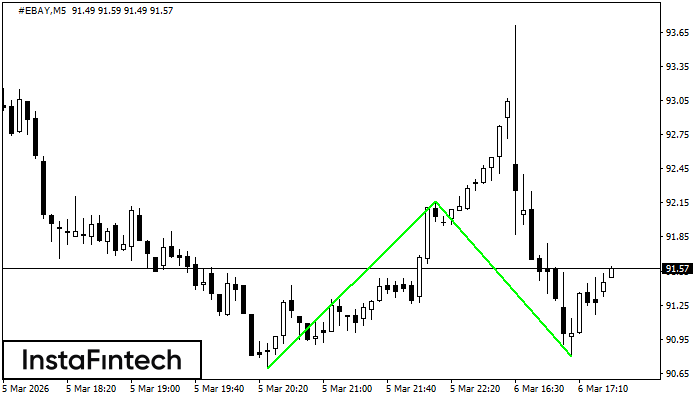
Bullish Symmetrical Triangle
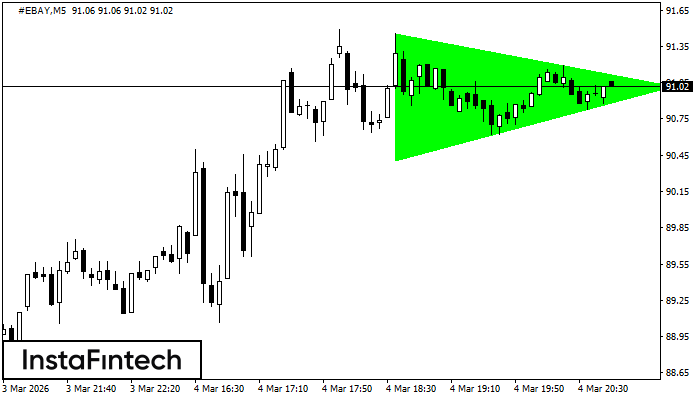
According to the chart of M5, #EBAY formed the Bullish Symmetrical Triangle pattern. Description: This is the pattern of a trend continuation. 91.46 and 90.41 are the coordinates of the upper and lower borders respectively. The pattern width is measured on the chart at 105 pips. Outlook: If the upper border 91.46 is broken, the price is likely to continue its move by 91.17.
#EBAY M5
Bullish Rectangle
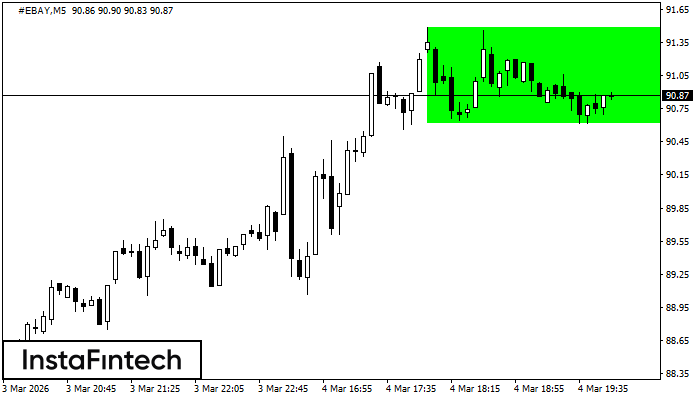
According to the chart of M5, #EBAY formed the Bullish Rectangle. The pattern indicates a trend continuation. The upper border is 91.49, the lower border is 90.62. The signal means that a long position should be opened above the upper border 91.49 of the Bullish Rectangle.
#EBAY M5
Double Bottom
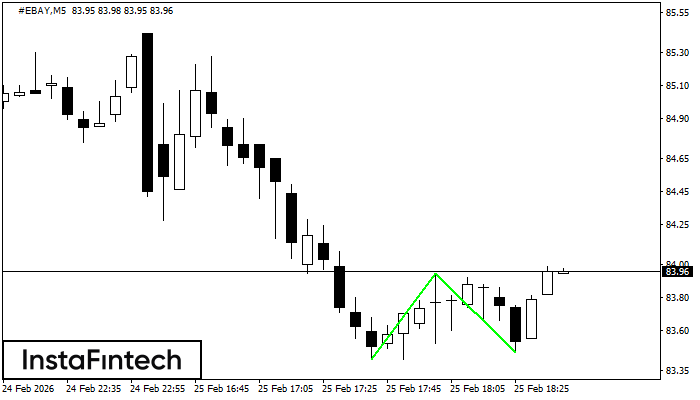
The Double Bottom pattern has been formed on #EBAY M5. Characteristics: the support level 83.42; the resistance level 83.95; the width of the pattern 53 points. If the resistance level is broken, a change in the trend can be predicted with the first target point lying at the distance of 49 points.
#EBAY H1
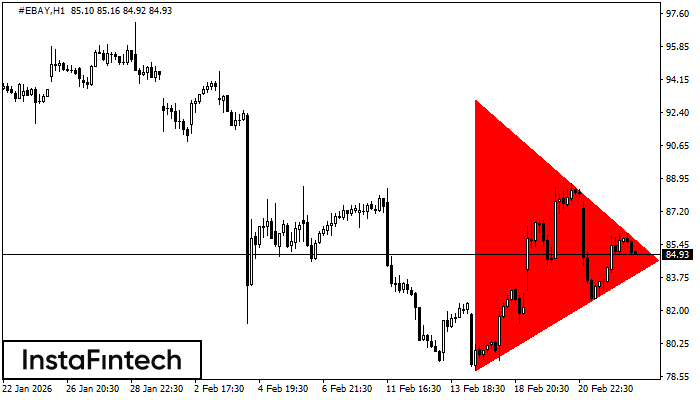
Bearish Symmetrical Triangle
According to the chart of H1, #EBAY formed the Bearish Symmetrical Triangle pattern. This pattern signals a further downward trend in case the lower border 78.86 is breached. Here, a hypothetical profit will equal the width of the available pattern that is -1423 pips.
#EBAY M5
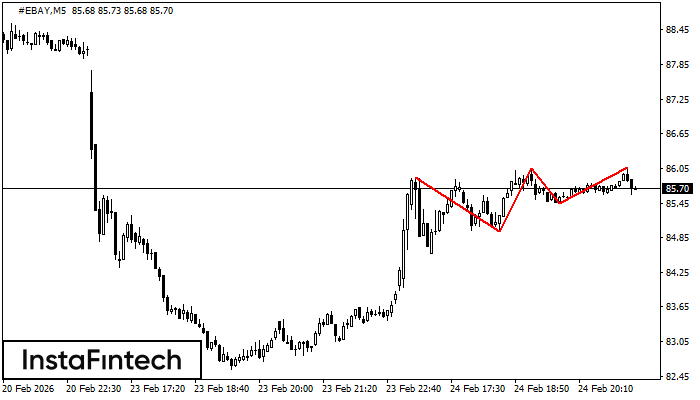
Triple Top
The Triple Top pattern has formed on the chart of the #EBAY M5 trading instrument. It is a reversal pattern featuring the following characteristics: resistance level -16, support level -48, and pattern’s width 94. Forecast If the price breaks through the support level 84.96, it is likely to move further down to 85.89.