 Română
  Русский
 English
 Bahasa Indonesia
 Bahasa Malay
 ไทย
ไทย Español
 Deutsch
 Български
 Français
 Tiếng Việt
 中文
中文 বাংলা
বাংলা हिन्दी
 Čeština
 Українська
FX.co ★ Patterns #Bitcoin | Bitcoin cryptocurrency Rate in the Forex market

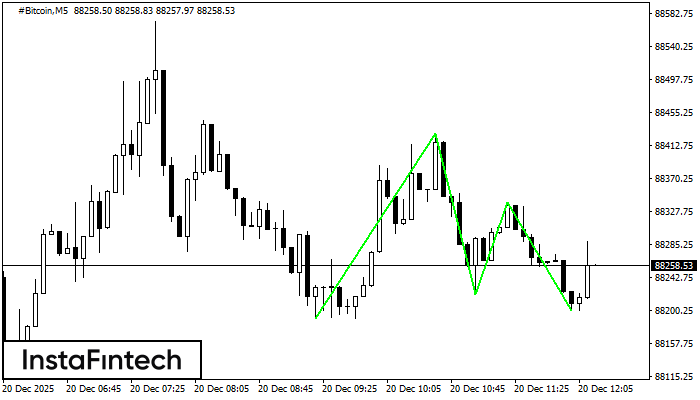
#Bitcoin M5
Triple Bottom
The Triple Bottom pattern has formed on the chart of the #Bitcoin M5 trading instrument. The pattern signals a change in the trend from downwards to upwards in the case of breakdown of 88428.61/88339.72.
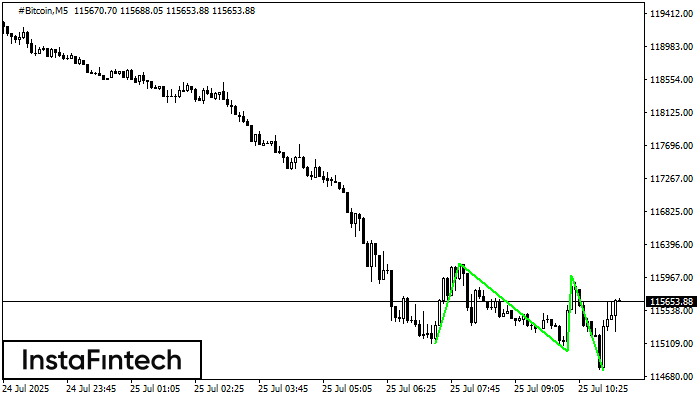
#Bitcoin M5
Triple Bottom
The Triple Bottom pattern has been formed on #Bitcoin M5. It has the following characteristics: resistance level 116154.33/115987.88; support level 115100.14/114755.07; the width is 105419 points. In the event of a breakdown of the resistance level of 116154.33, the price is likely to continue an upward movement at least to 114998.00.
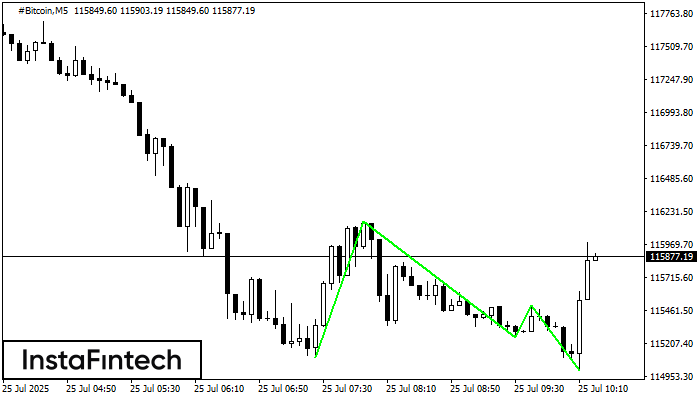
#Bitcoin M5
Triple Bottom
The Triple Bottom pattern has formed on the chart of #Bitcoin M5. Features of the pattern: The lower line of the pattern has coordinates 116154.33 with the upper limit 116154.33/115498.43, the projection of the width is 105419 points. The formation of the Triple Bottom pattern most likely indicates a change in the trend from downward to upward. This means that in the event of a breakdown of the resistance level 115100.14, the price is most likely to continue the upward movement.
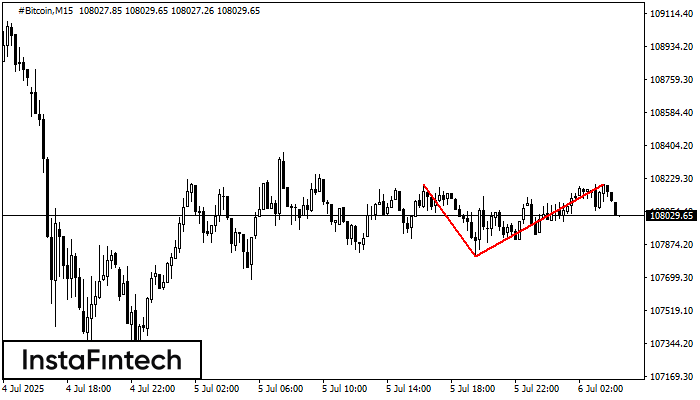
#Bitcoin M15
Double Top
On the chart of #Bitcoin M15 the Double Top reversal pattern has been formed. Characteristics: the upper boundary 108196.50; the lower boundary 107810.44; the width of the pattern 38606 points. The signal: a break of the lower boundary will cause continuation of the downward trend targeting the 107810.20 level.
#Bitcoin M5
Double Top
The Double Top pattern has been formed on #Bitcoin M5. It signals that the trend has been changed from upwards to downwards. Probably, if the base of the pattern 108059.29 is broken, the downward movement will continue.

#Bitcoin M5
Bearish Symmetrical Triangle
According to the chart of M5, #Bitcoin formed the Bearish Symmetrical Triangle pattern. Trading recommendations: A breach of the lower border 107810.44 is likely to encourage a continuation of the downward trend.
#Bitcoin M5
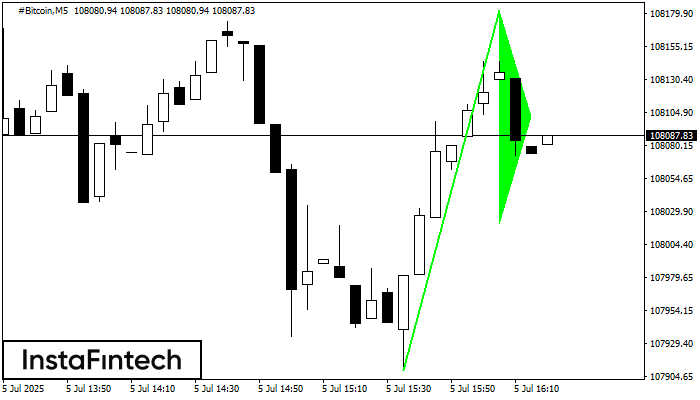
Bullish pennant
The Bullish pennant signal – Trading instrument #Bitcoin M5, continuation pattern. Forecast: it is possible to set up a buy position above the pattern’s high of 108182.82, with the prospect of the next move being a projection of the flagpole height.
#Bitcoin M5
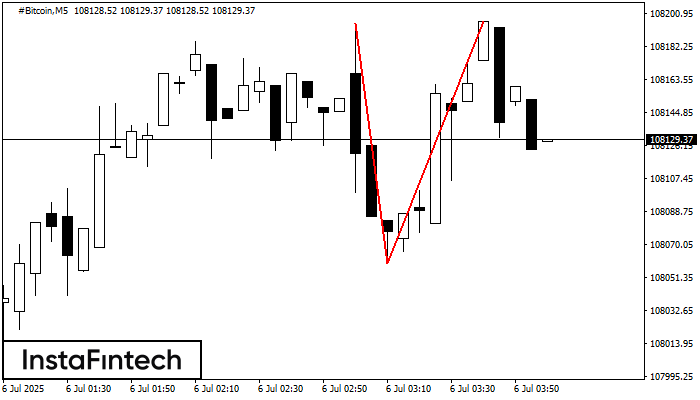
Double Top
The Double Top pattern has been formed on #Bitcoin M5. It signals that the trend has been changed from upwards to downwards. Probably, if the base of the pattern 108036.85 is broken, the downward movement will continue.
#Bitcoin M5
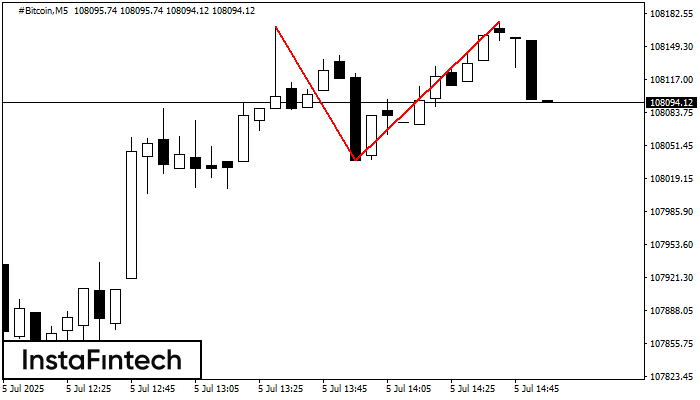
Double Bottom
The Double Bottom pattern has been formed on #Bitcoin M5. Characteristics: the support level 107955.72; the resistance level 108251.09; the width of the pattern 29537 points. If the resistance level is broken, a change in the trend can be predicted with the first target point lying at the distance of 30473 points.
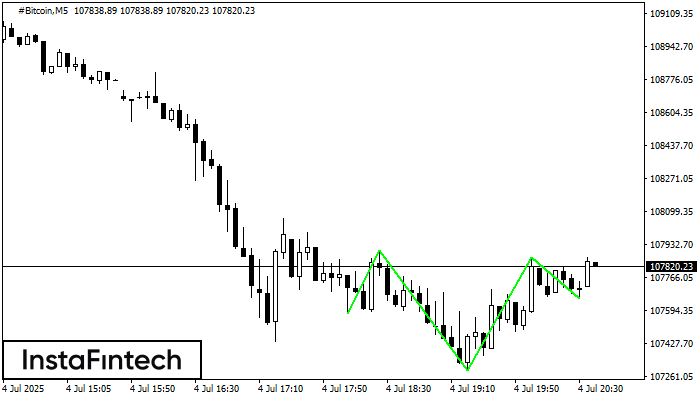
#Bitcoin M5
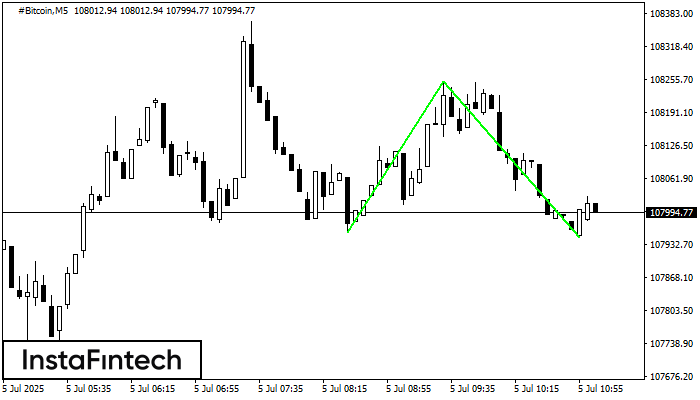
Inverse Head and Shoulder
According to the chart of M5, #Bitcoin produced the pattern termed the Inverse Head and Shoulder. The Head is fixed at 107290.48 while the median line of the Neck is set at 107901.08/107867.76. The formation of the Inverse Head and Shoulder Pattern clearly indicates a reversal of the downward trend. In means that in case the scenario comes true, the price of #Bitcoin will go towards 107867.90.