 Română
  Русский
 English
 Bahasa Indonesia
 Bahasa Malay
 ไทย
ไทย Español
 Deutsch
 Български
 Français
 Tiếng Việt
 中文
中文 বাংলা
বাংলা हिन्दी
 Čeština
 Українська
FX.co ★ Patterns #AAPL | Apple Inc. Stock Price


#AAPL M5
Double Top
The Double Top reversal pattern has been formed on #AAPL M5. Characteristics: the upper boundary 262.43; the lower boundary 261.27; the width of the pattern is 117 points. Sell trades are better to be opened below the lower boundary 261.27 with a possible movements towards the 261.12 level.
#AAPL M5
Double Top
The Double Top pattern has been formed on #AAPL M5. It signals that the trend has been changed from upwards to downwards. Probably, if the base of the pattern 256.90 is broken, the downward movement will continue.
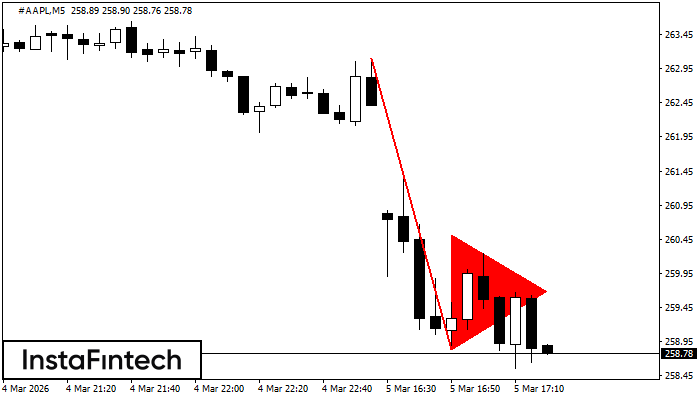
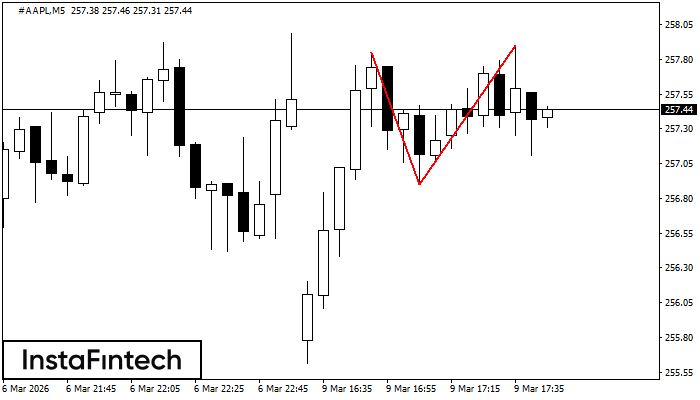
#AAPL M5
Bearish pennant
The Bearish pennant pattern has formed on the #AAPL M5 chart. It signals potential continuation of the existing trend. Specifications: the pattern’s bottom has the coordinate of 258.84; the projection of the flagpole height is equal to 426 pips. In case the price breaks out the pattern’s bottom of 258.84, the downtrend is expected to continue for further level 258.69.
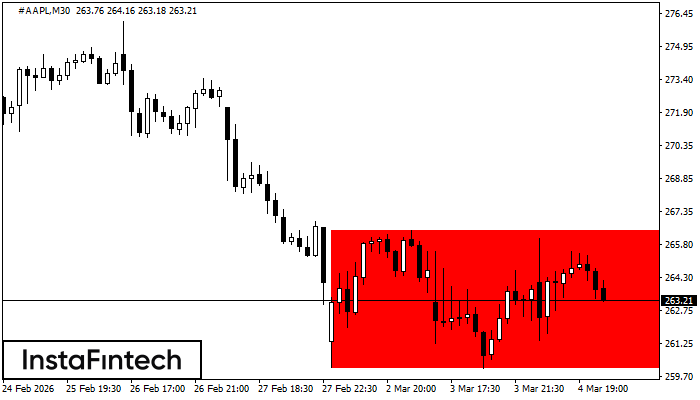
#AAPL M30
Bearish Rectangle
According to the chart of M30, #AAPL formed the Bearish Rectangle. This type of a pattern indicates a trend continuation. It consists of two levels: resistance 266.47 - 0.00 and support 260.09 – 260.09. In case the resistance level 260.09 - 260.09 is broken, the instrument is likely to follow the bearish trend.

#AAPL H1
Double Bottom
The Double Bottom pattern has been formed on #AAPL H1. This formation signals a reversal of the trend from downwards to upwards. The signal is that a buy trade should be opened after the upper boundary of the pattern 266.47 is broken. The further movements will rely on the width of the current pattern 632 points.
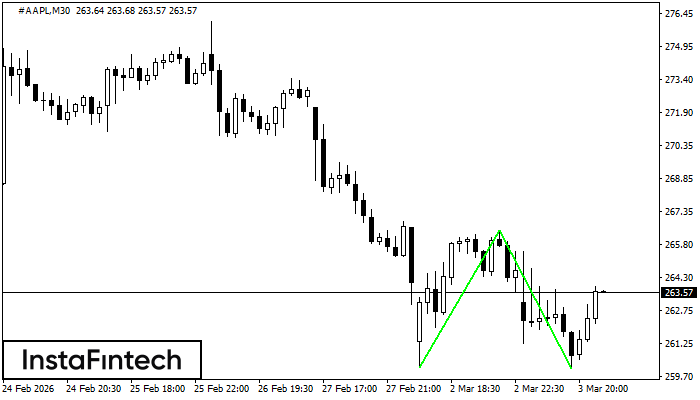
#AAPL M30
Double Bottom
The Double Bottom pattern has been formed on #AAPL M30. Characteristics: the support level 260.15; the resistance level 266.47; the width of the pattern 632 points. If the resistance level is broken, a change in the trend can be predicted with the first target point lying at the distance of 638 points.
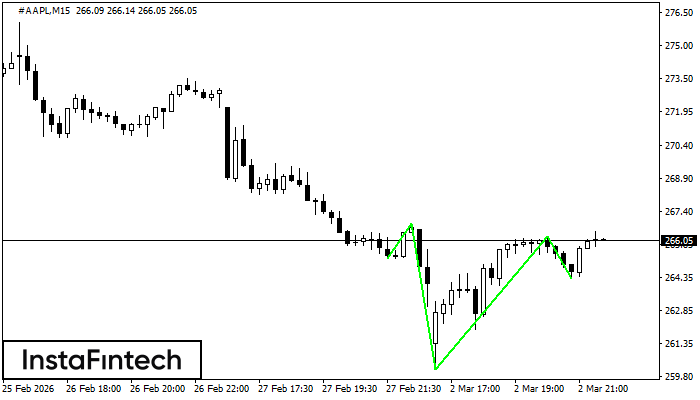
#AAPL M15
Inverse Head and Shoulder
According to the chart of M15, #AAPL produced the pattern termed the Inverse Head and Shoulder. The Head is fixed at 260.15 while the median line of the Neck is set at 266.85/266.25. The formation of the Inverse Head and Shoulder Pattern clearly indicates a reversal of the downward trend. In means that in case the scenario comes true, the price of #AAPL will go towards 266.48.
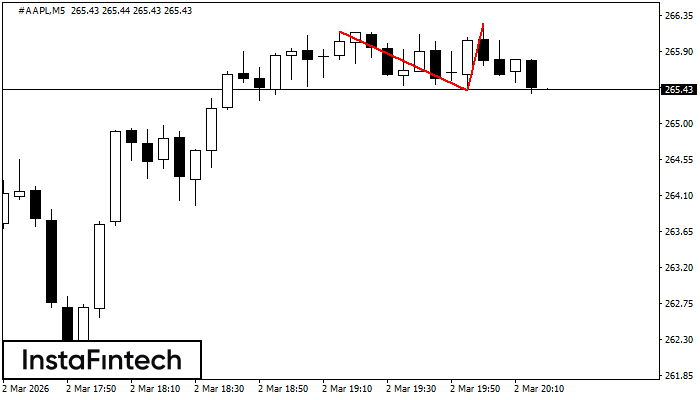
#AAPL M5
Double Top
On the chart of #AAPL M5 the Double Top reversal pattern has been formed. Characteristics: the upper boundary 266.25; the lower boundary 265.41; the width of the pattern 84 points. The signal: a break of the lower boundary will cause continuation of the downward trend targeting the 265.26 level.
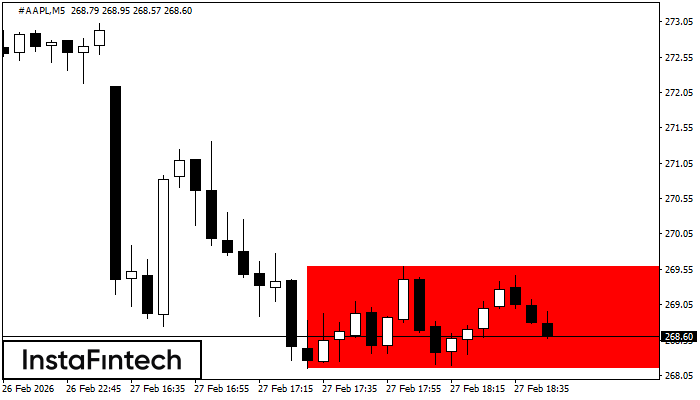
#AAPL M5
Bearish Rectangle
According to the chart of M5, #AAPL formed the Bearish Rectangle. This type of a pattern indicates a trend continuation. It consists of two levels: resistance 269.59 - 0.00 and support 268.15 – 268.15. In case the resistance level 268.15 - 268.15 is broken, the instrument is likely to follow the bearish trend.
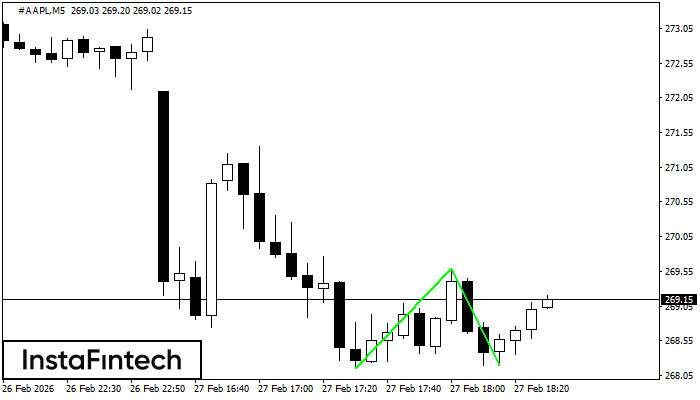
#AAPL M5
Double Bottom
The Double Bottom pattern has been formed on #AAPL M5. This formation signals a reversal of the trend from downwards to upwards. The signal is that a buy trade should be opened after the upper boundary of the pattern 269.59 is broken. The further movements will rely on the width of the current pattern 144 points.