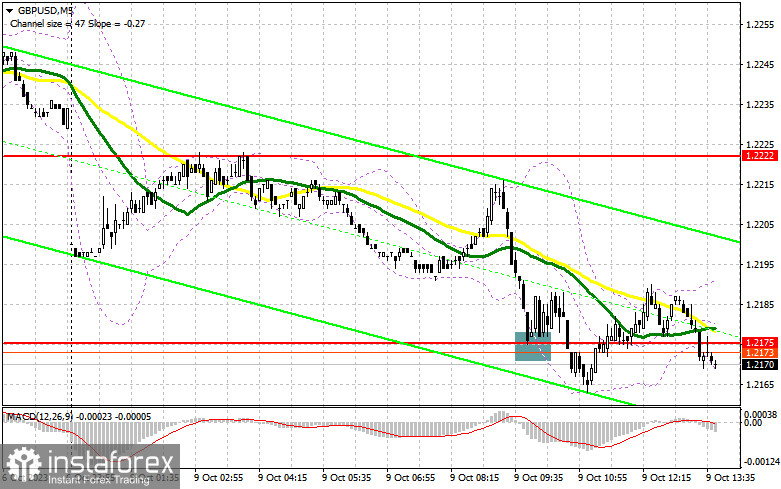
In my morning forecast, I pointed out the level of 1.2175 and recommended making entry decisions based on it. Let's take a look at the 5-minute chart and analyze what happened there. The decline and the formation of a false breakout at 1.2175 allowed for a good entry point for the continuation of the pair's recovery, but active growth did not materialize. For this reason, the technical picture was revised for the second half of the day.

To open long positions on GBP/USD, the following is required:
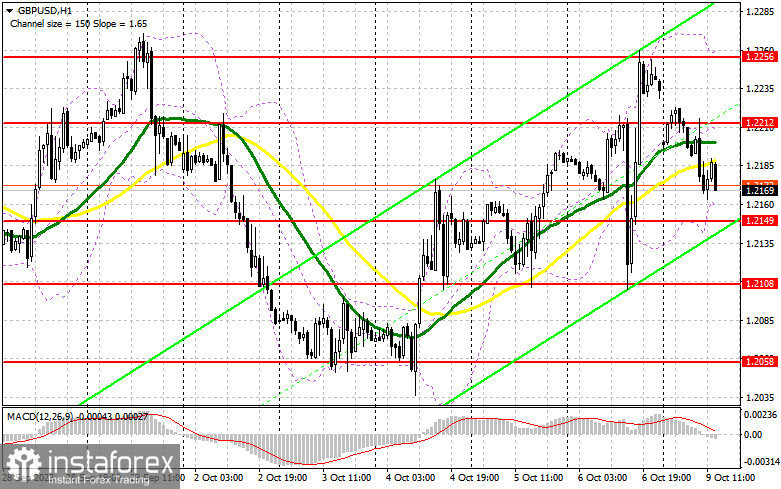
The absence of US statistics and only speeches by Federal Reserve representatives are unlikely to provide much support for the pound. However, buyers should not be ruled out, especially after they made their presence felt at the end of last week. I prefer to act after a decline and the formation of a false breakout around the new support at 1.2149, which will signal a buy with the target of a recovery to the nearest resistance at 1.2212. A breakthrough and consolidation above this range will bring demand back to GBP/USD, providing a chance for further upward correction with a target of 1.2256. The ultimate target will be the area around 1.2327, but that's only possible with very dovish statements from Federal Reserve representatives. In the scenario of a decline to 1.2149 and a lack of activity there in the second half of the day, the situation for pound buyers will worsen, opening the way to 1.2108. A false breakout there will signal long positions. I plan to buy GBP/USD immediately on a rebound only from the minimum of 1.2058, with a target of a 30-35 point intraday correction.
To open short positions on GBP/USD, the following is required:
The bears have brought balance back to the market, and now trading is taking on more of a sideways character. Therefore, the focus is on protecting, and a false breakout of the nearest resistance at 1.2212 forms at the end of the first half of the day. An unsuccessful attempt to break out above will signal a sell-off, capable of pushing the pair down to 1.2149. A breakthrough and a bottom-up retest of this range will deal a more serious blow to the bull positions, opening the way to 1.2108, where the pound was actively bought last Friday. The ultimate target will be 1.2058, where I will take a profit. In the scenario of GBP/USD rising and a lack of activity at 1.2212 in the second half of the day, which is likely to happen, the pressure on the pair will ease, giving buyers a chance for further upward correction. In that case, I will postpone selling until there is a false breakout at 1.2256. If there is no downward movement, I will sell the pound immediately on a rebound from 1.2327, but only with the expectation of a 30-35 point intraday correction.


Indicator signals:
Moving Averages
Trading is taking place around the 30 and 50-day moving averages, indicating a sideways market.
Note: The period and prices of the moving averages considered by the author are on the H1 hourly chart and differ from the general definition of classical daily moving averages on the D1 daily chart.
Bollinger Bands
In case of a decline, the lower boundary of the indicator at around 1.2170 will act as support.
Description of indicators:
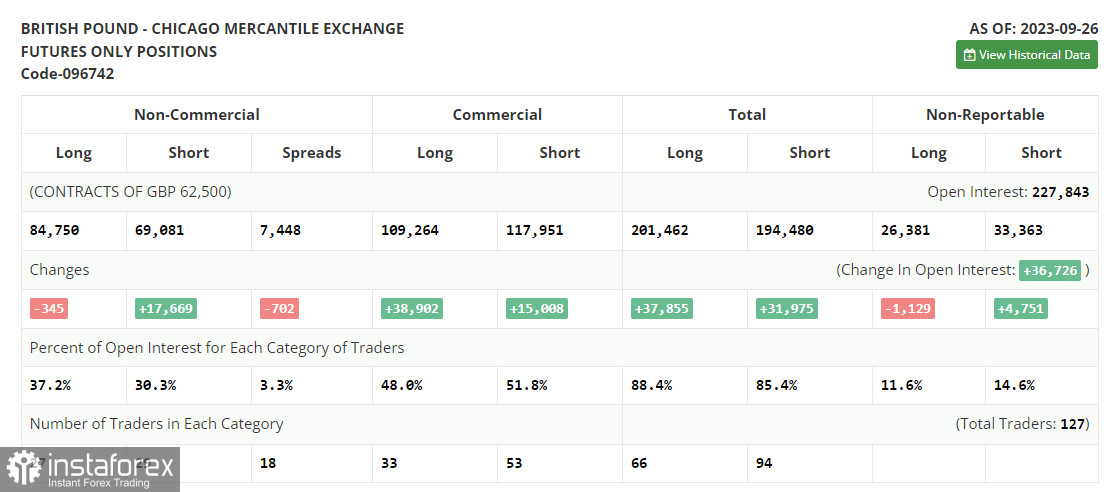
Moving average (determines the current trend by smoothing volatility and noise). Period 50. Marked in yellow on the chart.Moving average (determines the current trend by smoothing volatility and noise). Period 30. Marked in green on the chart.MACD indicator (Moving Average Convergence/Divergence - convergence/divergence of moving averages). Fast EMA period 12. Slow EMA period 26. SMA period 9.Bollinger Bands. Period 20.Non-commercial traders - speculators such as individual traders, hedge funds, and large institutions using the futures market for speculative purposes and meeting certain requirements.Long non-commercial positions represent the total long open positions of non-commercial traders.Short non-commercial positions represent the total short open positions of non-commercial traders.The total non-commercial net position is the difference between the short and long positions of non-commercial traders. Bahasa Indonesia
 Русский
 English
 Bahasa Malay
 ไทย
ไทย Español
 Deutsch
 Български
 Français
 Tiếng Việt
 中文
中文 বাংলা
বাংলা हिन्दी
 Čeština
 Українська
 Română

