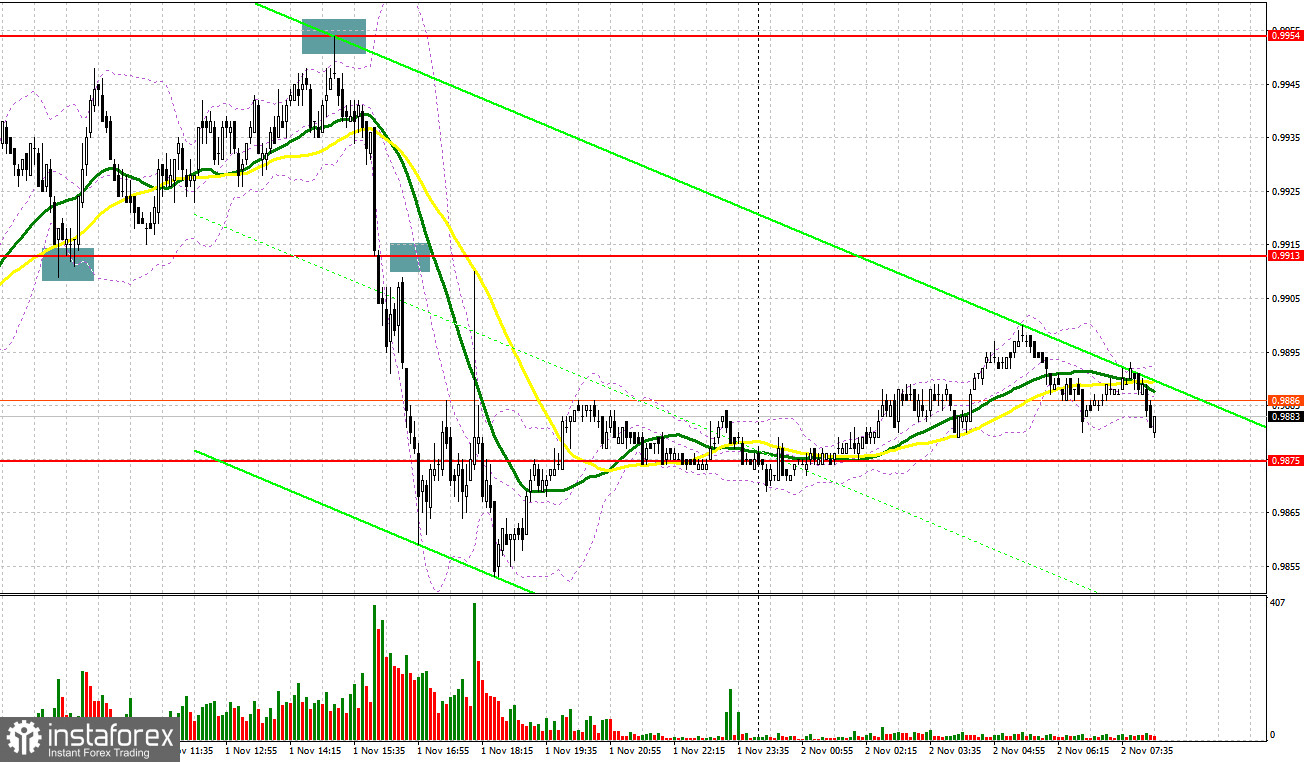
Yesterday, traders received several signals to enter the market. Let us take a look at the 5-minute chart to clear up the market situation. Earlier, I asked you to pay attention to the level of 0.9913 to decide when to enter the market. A decline and a false breakout of this level provided traders with a long signal. As a result, the pair climbed by 35 pips. However, it failed to reach the nearest resistance level of 0.9954. In the second part of the day, the price showed a false breakout of 0.9954, which led to a perfect sell signal. The pair dropped by more than 80 pips. However, traders did not have a chance to open more short orders at 0.9913 since there was no upward test of this level.

Conditions for opening long positions on EUR/USD
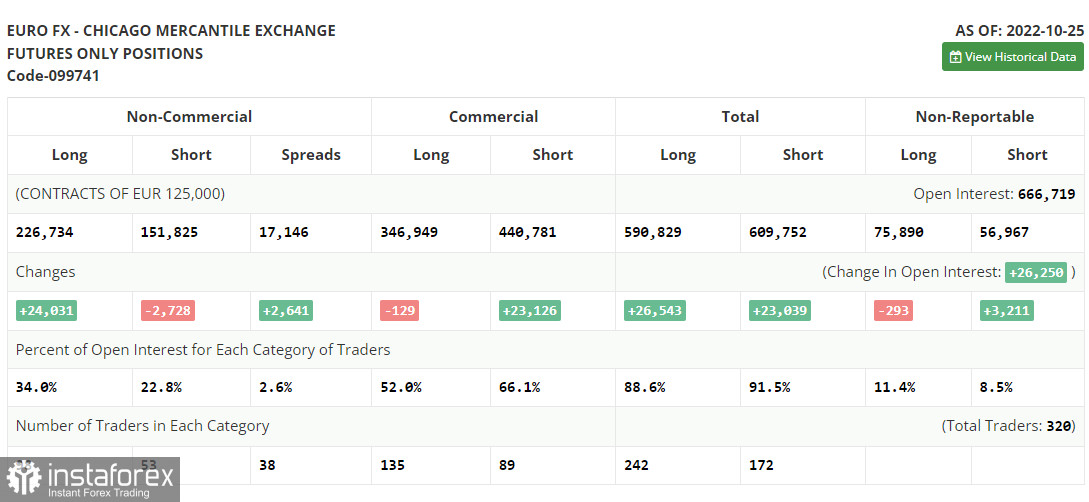
First of all, let us focus on the futures market and the COT report. According to the recent report from October 25, the number of short positions declined, whereas the number of long positions increased. It is obvious that demand for the US dollar has fallen. The fact is that there are more and more signs of an economic recession caused by the extremely aggressive Fed policy. It is highly possible that this week, the FOMC will raise the benchmark rate and will continue doing this ignoring economic problems until inflation starts sliding. However, the upward potential of the euro is also limited. Not so long ago, the ECB said that it might revise its policy and switch to a more dovish approach if the eurozone economy contracted even more. According to the COT report, the number of long non-commercial positions increased by 24,031 to 226,734, while the number of short non-commercial positions declined by 2,728 to 151,825. At the end of the week, the total non-commercial net position remained positive at 74,909 compared to 48,150 a week earlier. This indicates that investors are benefiting from the situation and continue to buy the cheap euro below parity, as well as accumulate long positions, expecting the end of the crisis. The weekly closing price rose to 1.0000 from 0.9895.

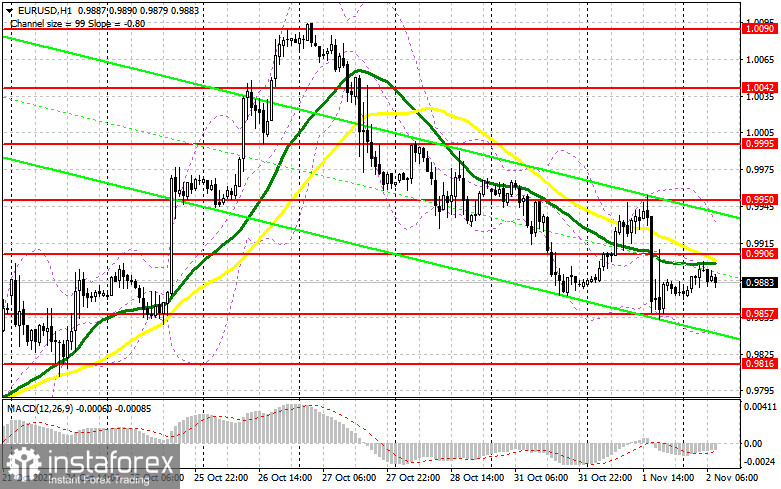
Today, Germany will disclose a bulk of information that may have a negative influence on the euro's future rise. The situation is likely to be the same as yesterday when the US PMI data allowed the US dollar to return to the weekly high and put significant pressure on the euro. Traders should pay attention to the number of unemployed people and the unemployment rate in Germany as well as Germany's and the eurozone manufacturing PMI. If the unemployment rate data is not very important, a decline in the eurozone manufacturing sector may increase pressure on the euro ahead of the Fed's meeting. If the euro/dollar pair declines, only a false breakout of 0.9857 will give a long signal. In this case, the price may hit a new resistance level of 0.9906. A breakout and a downward test of this level will allow the pair to climb to a new high of 0.9950. In this case, it may climb higher to 0.9995. The farthest target is located at 1.0042. If the price hits this level, the market situation may change significantly. Traders should lock in profits at this level. If the pair declines and buyers fail to protect 0.9857, sellers will regain control over the market. A false breakout of the support level of 0.9816 will give a long signal. It is also possible to go long after a bounce off the support level of 0.9784 or lower – from the low of 0.9747, expecting a rise of 30-35 pips.
Conditions for opening short positions in EUR/USD:
Sellers continue to exert pressure on the euro. Recently, traders have been showing a stronger reaction to the data from the US. There are several reasons for that. Traders try to find out whether the US economy is tipping into recession or the Fed is able to keep a balance between high interest rates and slower GDP growth. It is obvious that a false breakout of the nearest resistance level of 0.9906 will give a good sell signal. The pair may climb to this level in case of strong data from Germany. If the price fails to consolidate at this level, it may decline to 0.9857. A breakout and settlement below this level as well as an upward test will give an additional sell signal with the target at 0.9816, where it is recommended to lock in profits. The pair will be able to slide below this level only amid strong data from the US. If the euro/dollar pair declines during the European session and bears fail to protect 0.9906, we may see a jump. Then, it will be wise to avoid selling until the price hits 0.9950. A false breakout will give a new sell signal. It is also possible to go short after a rebound from the high of 0.9995 or higher – from 1.0040, expecting a decline of 30-35 pips.

Signals of indicators:
Moving Averages
Trading is performed below the 30- and 50-day moving averages, which points to a further decline in the euro.
Note: The period and prices of moving averages are considered by the author on the one-hour chart, which differs from the general definition of the classic daily moving averages on the daily chart.
Bollinger Bands
If the euro/dollar pair drops, the lower limit of the indicator located at 0.9840 will act as support. If the pair breaks the upper limit of the indicator located at 0.9935, it is likely to go on gaining in value.
Description of indicators
- Moving average (moving average, determines the current trend by smoothing volatility and noise). The period is 50. It is marked in yellow on the chart.
- Moving average (moving average, determines the current trend by smoothing volatility and noise). The period is 30. It is marked in green on the graph.
- MACD indicator (Moving Average Convergence/Divergence - convergence/divergence of moving averages). A fast EMA period is 12. A slow EMA period is 26. The SMA period is 9.
- Bollinger Bands. The period is 20.
- Non-profit speculative traders are individual traders, hedge funds, and large institutions that use the futures market for speculative purposes and meet certain requirements.
- Long non-commercial positions are the total number of long positions opened by non-commercial traders.
- Short non-commercial positions are the total number of short positions opened by non-commercial traders.
- The total non-commercial net position is a difference in the number of short and long positions opened by non-commercial traders.
 Bahasa Indonesia
 Русский
 English
 Bahasa Malay
 ไทย
ไทย Español
 Deutsch
 Български
 Français
 Tiếng Việt
 中文
中文 বাংলা
বাংলা हिन्दी
 Čeština
 Українська
 Română

