 Français
  Русский
 English
 Bahasa Indonesia
 Bahasa Malay
 ไทย
ไทย Español
 Deutsch
 Български
 Tiếng Việt
 中文
中文 বাংলা
বাংলা हिन्दी
 Čeština
 Українська
 Română
FX.co ★ Patterns SILVER | Silver Rate in the Forex market

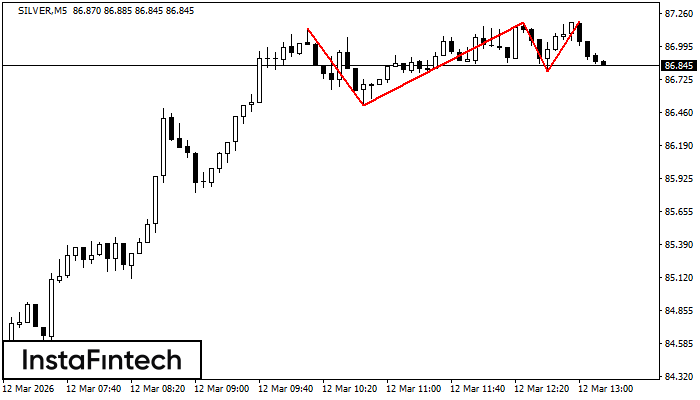
SILVER M5
Triple Top
On the chart of the SILVER M5 trading instrument, the Triple Top pattern that signals a trend change has formed. It is possible that after formation of the third peak, the price will try to break through the resistance level 86.52, where we advise to open a trading position for sale. Take profit is the projection of the pattern’s width, which is 625 points.
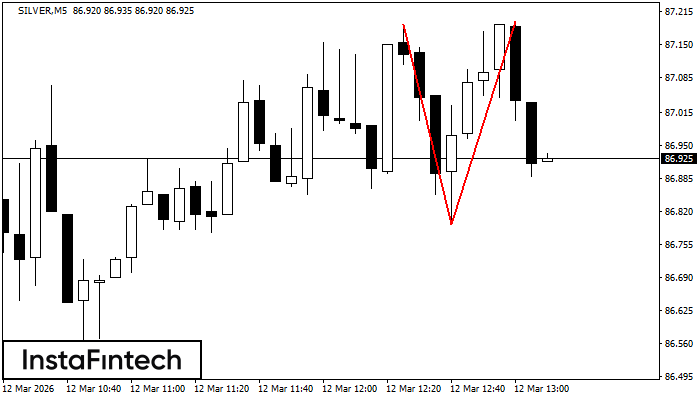
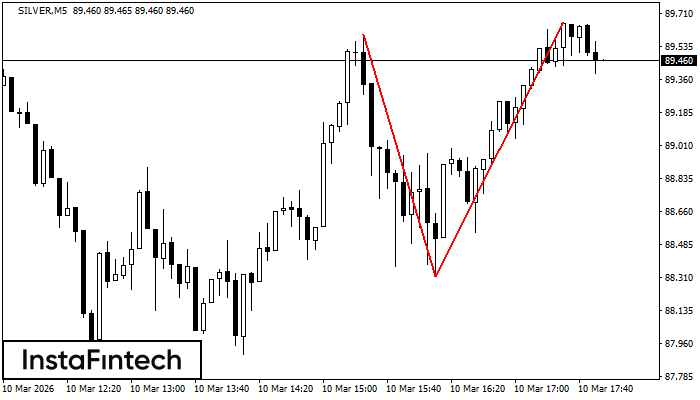
SILVER M5
Double Top
The Double Top pattern has been formed on SILVER M5. It signals that the trend has been changed from upwards to downwards. Probably, if the base of the pattern 86.80 is broken, the downward movement will continue.
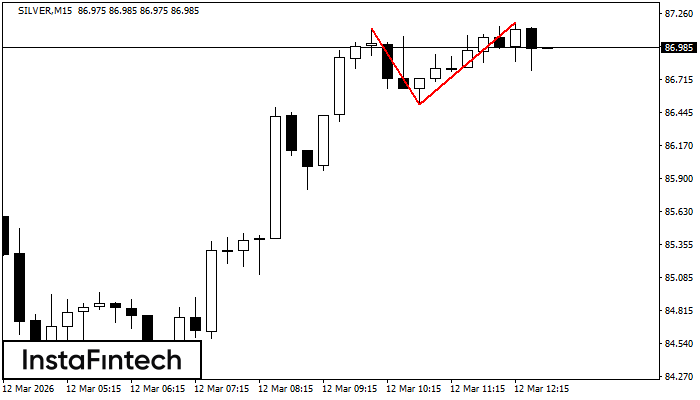
SILVER M15
Double Top
The Double Top pattern has been formed on SILVER M15. It signals that the trend has been changed from upwards to downwards. Probably, if the base of the pattern 86.52 is broken, the downward movement will continue.
SILVER M5
Double Bottom
The Double Bottom pattern has been formed on SILVER M5; the upper boundary is 85.89; the lower boundary is 84.44. The width of the pattern is 1460 points. In case of a break of the upper boundary 85.89, a change in the trend can be predicted where the width of the pattern will coincide with the distance to a possible take profit level.
SILVER M5
Triple Top
The Triple Top pattern has formed on the chart of the SILVER M5 trading instrument. It is a reversal pattern featuring the following characteristics: resistance level -60, support level -720, and pattern’s width 1285. Forecast If the price breaks through the support level 88.31, it is likely to move further down to 89.64.
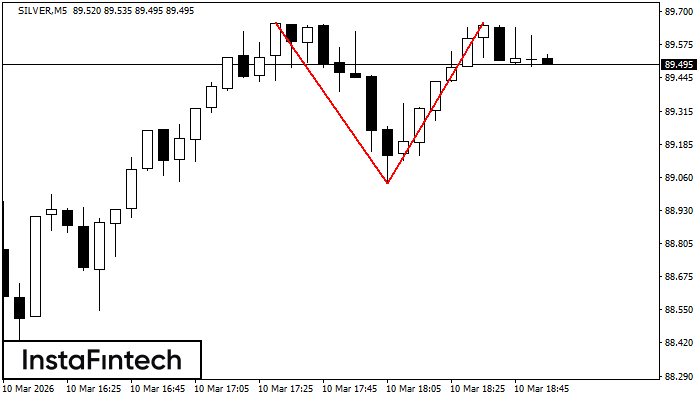
SILVER M5
Double Top
The Double Top reversal pattern has been formed on SILVER M5. Characteristics: the upper boundary 89.66; the lower boundary 89.03; the width of the pattern is 625 points. Sell trades are better to be opened below the lower boundary 89.03 with a possible movements towards the 89.02 level.
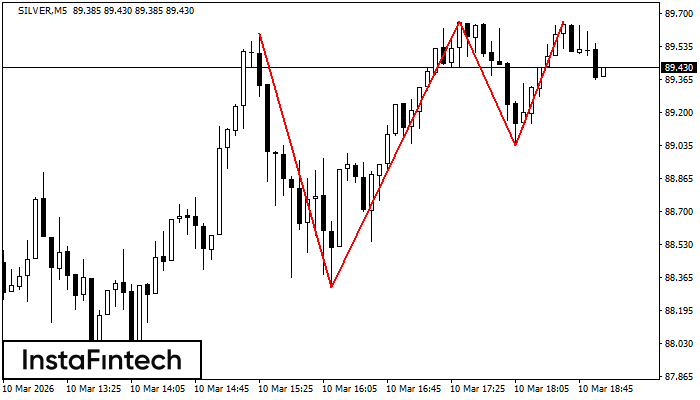
SILVER M5
Double Top
On the chart of SILVER M5 the Double Top reversal pattern has been formed. Characteristics: the upper boundary 89.66; the lower boundary 88.31; the width of the pattern 1345 points. The signal: a break of the lower boundary will cause continuation of the downward trend targeting the 88.30 level.
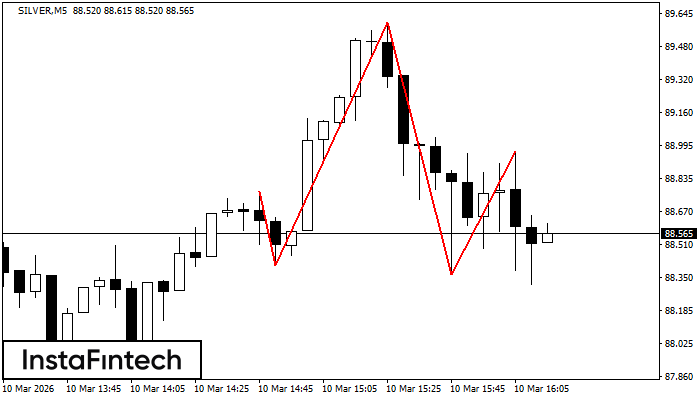
SILVER M5
Head and Shoulders
The technical pattern called Head and Shoulders has appeared on the chart of SILVER M5. There are weighty reasons to suggest that the price will surpass the Neckline 88.41/88.36 after the right shoulder has been formed. So, the trend is set to change with the price heading for 88.35.
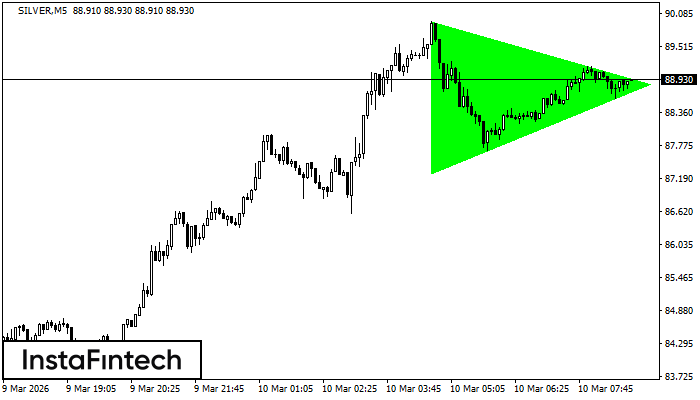
SILVER M5
Bullish Symmetrical Triangle
According to the chart of M5, SILVER formed the Bullish Symmetrical Triangle pattern. Description: This is the pattern of a trend continuation. 89.94 and 87.29 are the coordinates of the upper and lower borders respectively. The pattern width is measured on the chart at 2651 pips. Outlook: If the upper border 89.94 is broken, the price is likely to continue its move by 88.86.
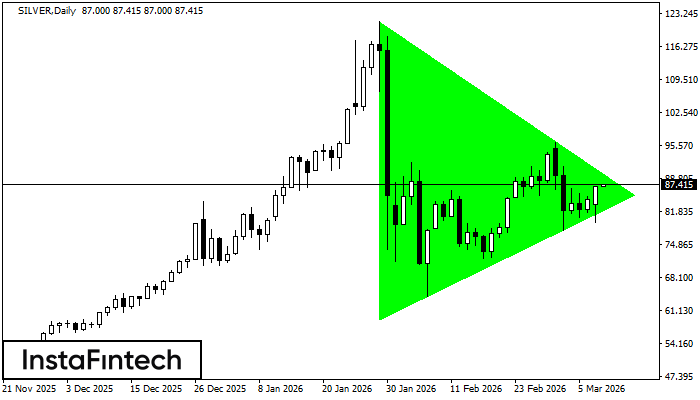
SILVER D1
Bullish Symmetrical Triangle
According to the chart of D1, SILVER formed the Bullish Symmetrical Triangle pattern. Description: This is the pattern of a trend continuation. 121.59 and 59.16 are the coordinates of the upper and lower borders respectively. The pattern width is measured on the chart at 62437 pips. Outlook: If the upper border 121.59 is broken, the price is likely to continue its move by 85.13.