 Français
  Русский
 English
 Bahasa Indonesia
 Bahasa Malay
 ไทย
ไทย Español
 Deutsch
 Български
 Tiếng Việt
 中文
中文 বাংলা
বাংলা हिन्दी
 Čeština
 Українська
 Română
FX.co ★ Patterns NZDCAD | New Zealand Dollar (NZD) to Canadian Dollar (CAD) Rate in the Forex market

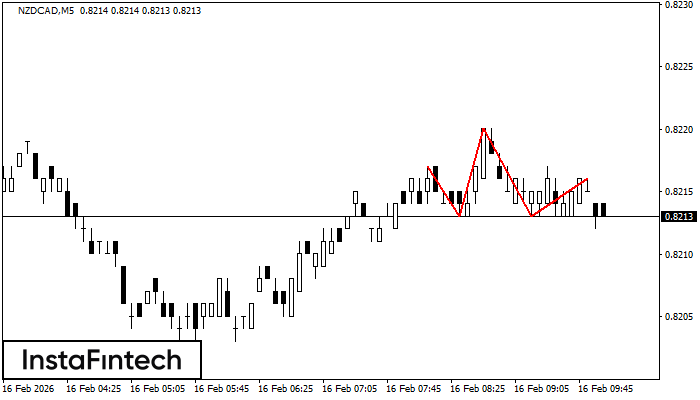
NZDCAD M5
Head and Shoulders
The NZDCAD M5 formed the Head and Shoulders pattern with the following features: The Head’s top is at 0.8220, the Neckline and the upward angle are at 0.8213/0.8213. The formation of this pattern can bring about changes in the current trend from bullish to bearish. In case the pattern triggers the expected changes, the price of NZDCAD will go towards 0.8198.
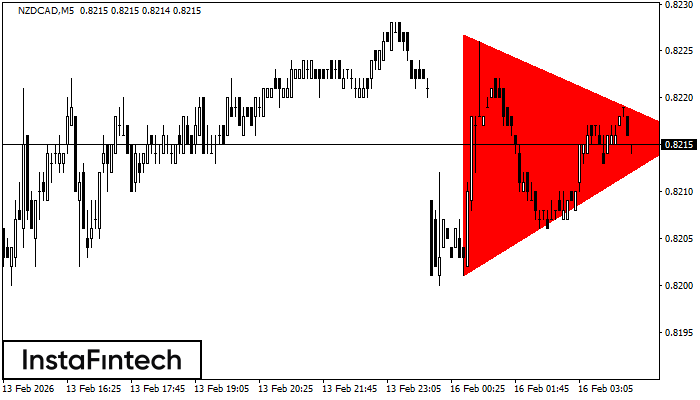
NZDCAD M5
Bearish Symmetrical Triangle
According to the chart of M5, NZDCAD formed the Bearish Symmetrical Triangle pattern. Description: The lower border is 0.8201/0.8216 and upper border is 0.8227/0.8216. The pattern width is measured on the chart at -26 pips. The formation of the Bearish Symmetrical Triangle pattern evidently signals a continuation of the downward trend. In other words, if the scenario comes true and NZDCAD breaches the lower border, the price could continue its move toward 0.8201.
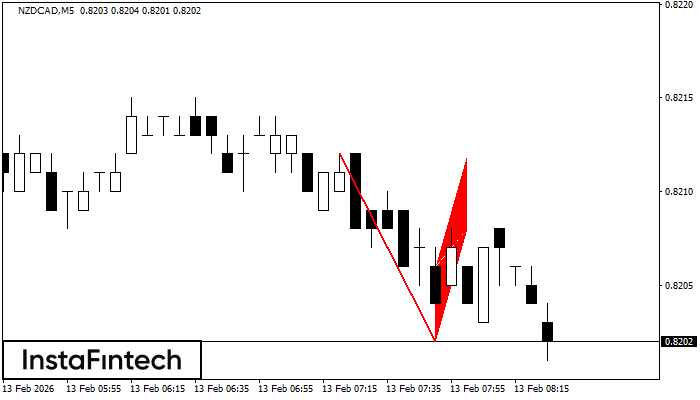
NZDCAD M5
Bearish Flag
The Bearish Flag pattern has been formed on NZDCAD at M5. The lower boundary of the pattern is located at 0.8202/0.8208 while the upper boundary lies at 0.8206/0.8212. The projection of the flagpole is 10 points. This formation signals that the downward trend is most likely to continue. Therefore, if the level of 0.8202 is broken, the price will move further downwards.
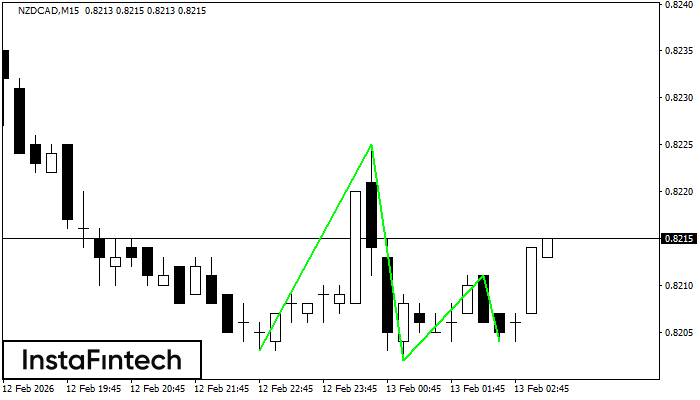
NZDCAD M15
Triple Bottom
The Triple Bottom pattern has been formed on NZDCAD M15. It has the following characteristics: resistance level 0.8225/0.8211; support level 0.8203/0.8204; the width is 22 points. In the event of a breakdown of the resistance level of 0.8225, the price is likely to continue an upward movement at least to 0.8224.
NZDCAD H1
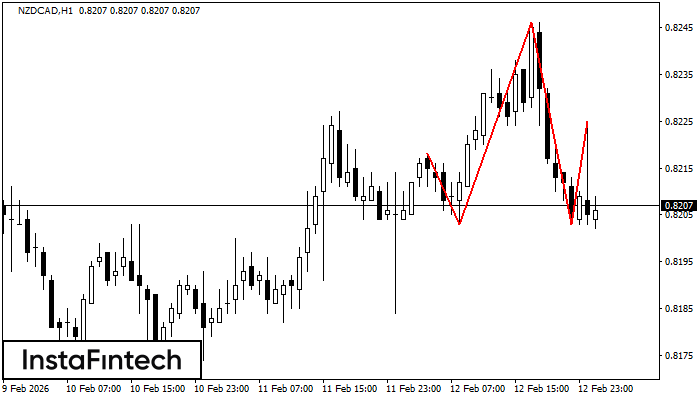
Head and Shoulders
The NZDCAD H1 formed the Head and Shoulders pattern with the following features: The Head’s top is at 0.8246, the Neckline and the upward angle are at 0.8203/0.8203. The formation of this pattern can bring about changes in the current trend from bullish to bearish. In case the pattern triggers the expected changes, the price of NZDCAD will go towards 0.8163.
NZDCAD M5
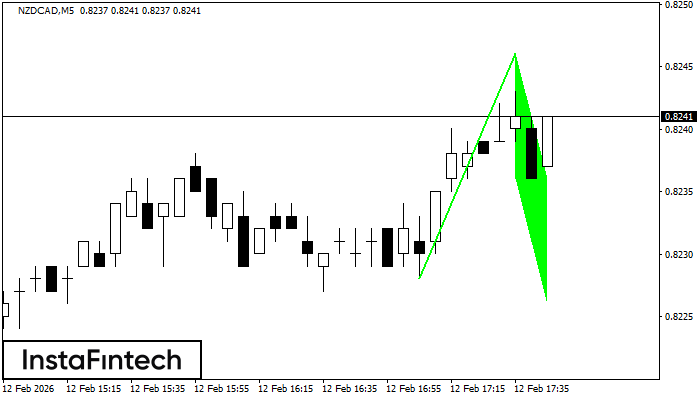
Bullish Flag
The Bullish Flag pattern has been formed on NZDCAD at M5. The lower boundary of the pattern is located at 0.8236/0.8226, while the higher boundary lies at 0.8246/0.8236. The projection of the flagpole is 18 points. This formation signals that the upward trend is most likely to continue. Therefore, if the level of 0.8246 is broken, the price will move further upwards.
NZDCAD M5
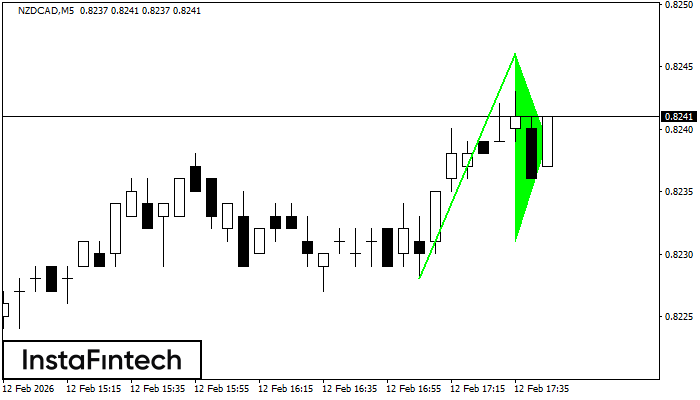
Bullish pennant
The Bullish pennant pattern is formed on the NZDCAD M5 chart. It is a type of the continuation pattern. Supposedly, in case the price is fixed above the pennant’s high of 0.8246, a further uptrend is possible.
NZDCAD M5
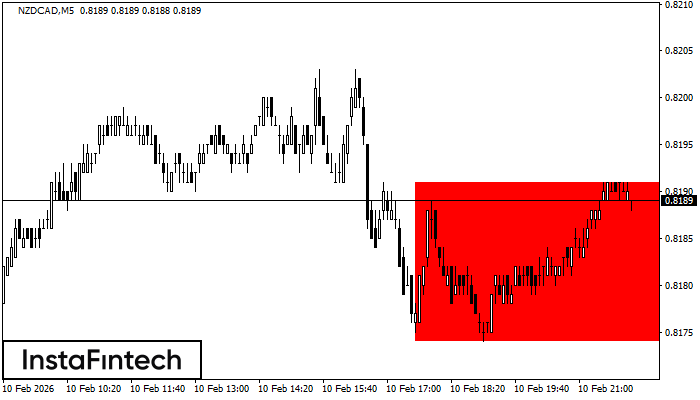
Bearish Rectangle
According to the chart of M5, NZDCAD formed the Bearish Rectangle. The pattern indicates a trend continuation. The upper border is 0.8191, the lower border is 0.8174. The signal means that a short position should be opened after fixing a price below the lower border 0.8174 of the Bearish Rectangle.
NZDCAD M5
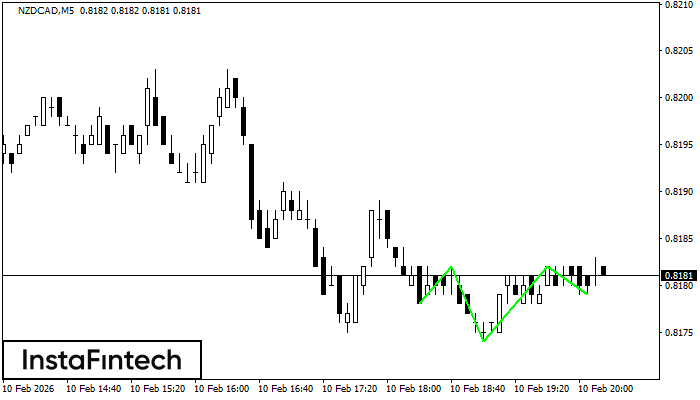
Inverse Head and Shoulder
According to the chart of M5, NZDCAD formed the Inverse Head and Shoulder pattern. The Head’s top is set at 0.8182 while the median line of the Neck is found at 0.8174/0.8179. The formation of the Inverse Head and Shoulder pattern evidently signals a reversal of the downward trend. In other words, in case the scenario comes true, the price of NZDCAD will go towards 0.8197
NZDCAD M15
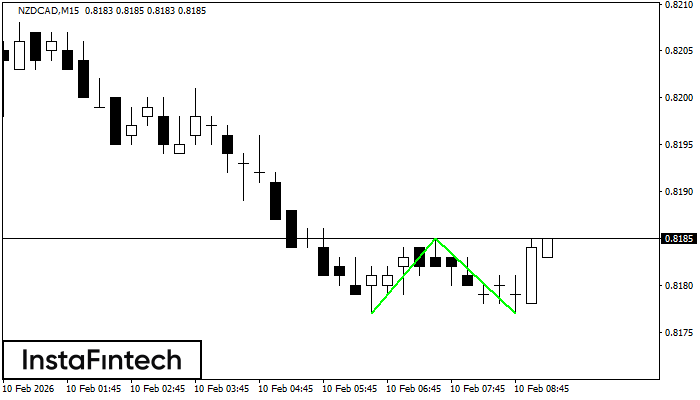
Double Bottom
The Double Bottom pattern has been formed on NZDCAD M15. Characteristics: the support level 0.8177; the resistance level 0.8185; the width of the pattern 8 points. If the resistance level is broken, a change in the trend can be predicted with the first target point lying at the distance of 8 points.