 Français
  Русский
 English
 Bahasa Indonesia
 Bahasa Malay
 ไทย
ไทย Español
 Deutsch
 Български
 Tiếng Việt
 中文
中文 বাংলা
বাংলা हिन्दी
 Čeština
 Українська
 Română
FX.co ★ Patterns #NTDOY | Nintendo Co., Ltd. Stock Price

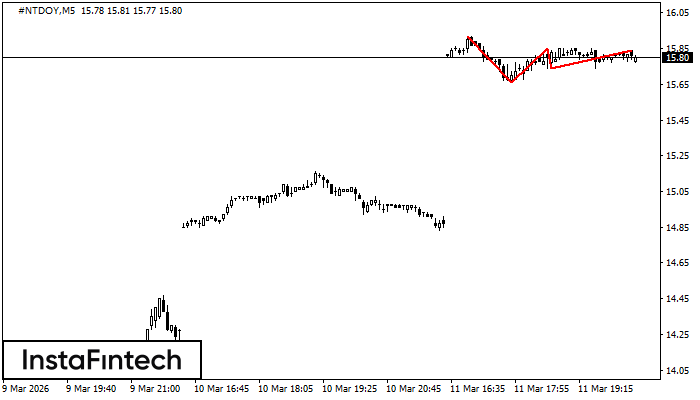
#NTDOY M5
Triple Top
The Triple Top pattern has formed on the chart of the #NTDOY M5 trading instrument. It is a reversal pattern featuring the following characteristics: resistance level 8, support level -8, and pattern’s width 26. Forecast If the price breaks through the support level 15.66, it is likely to move further down to 15.70.
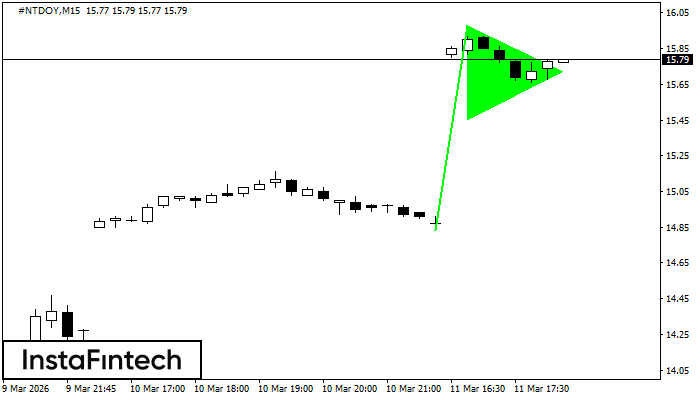
#NTDOY M15
Bullish pennant
The Bullish pennant signal – Trading instrument #NTDOY M15, continuation pattern. Forecast: it is possible to set up a buy position above the pattern’s high of 15.98, with the prospect of the next move being a projection of the flagpole height.

#NTDOY M30
Bullish pennant
The Bullish pennant signal – Trading instrument #NTDOY M30, continuation pattern. Forecast: it is possible to set up a buy position above the pattern’s high of 16.01, with the prospect of the next move being a projection of the flagpole height.
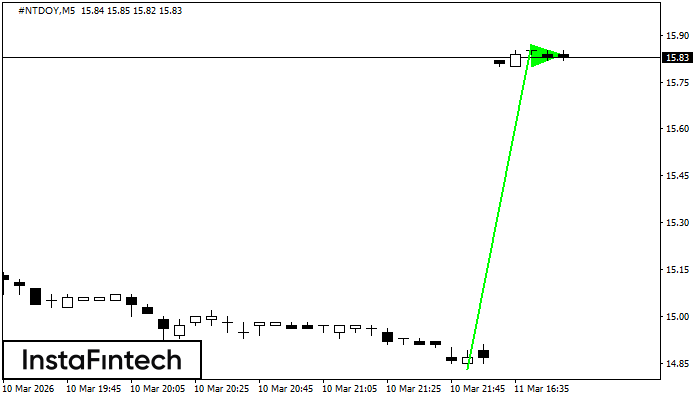
#NTDOY M5
Bullish pennant
The Bullish pennant signal – Trading instrument #NTDOY M5, continuation pattern. Forecast: it is possible to set up a buy position above the pattern’s high of 15.87, with the prospect of the next move being a projection of the flagpole height.
#NTDOY M15
Bullish pennant
The Bullish pennant graphic pattern has formed on the #NTDOY M15 instrument. This pattern type falls under the category of continuation patterns. In this case, if the quote can breaks out high, is expected to continue the upward trend to level 15.27.
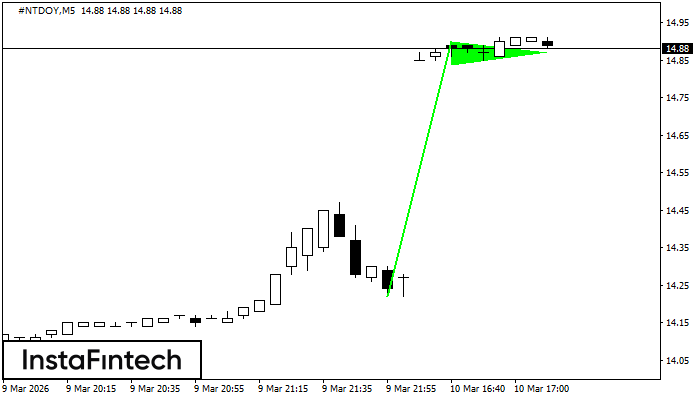
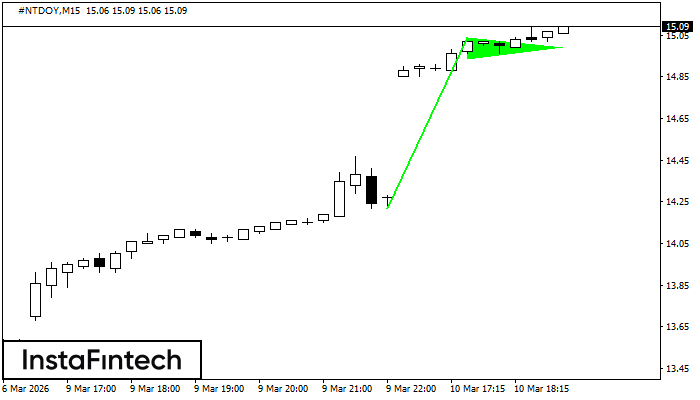
#NTDOY M5
Bullish pennant
The Bullish pennant signal – Trading instrument #NTDOY M5, continuation pattern. Forecast: it is possible to set up a buy position above the pattern’s high of 14.90, with the prospect of the next move being a projection of the flagpole height.
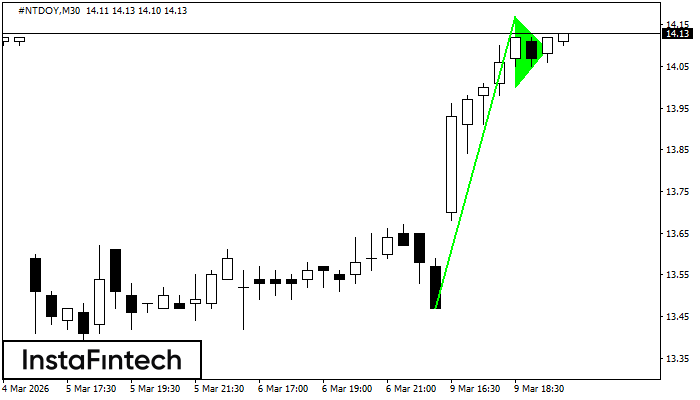
#NTDOY M30
Bullish pennant
The Bullish pennant signal – Trading instrument #NTDOY M30, continuation pattern. Forecast: it is possible to set up a buy position above the pattern’s high of 14.17, with the prospect of the next move being a projection of the flagpole height.
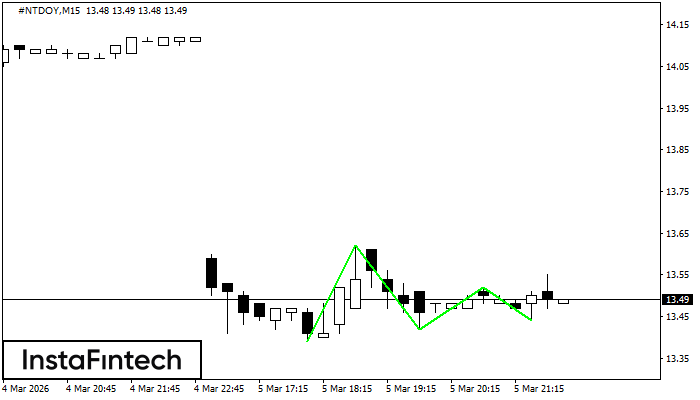
#NTDOY M15
Triple Bottom
The Triple Bottom pattern has formed on the chart of #NTDOY M15. Features of the pattern: The lower line of the pattern has coordinates 13.62 with the upper limit 13.62/13.52, the projection of the width is 23 points. The formation of the Triple Bottom pattern most likely indicates a change in the trend from downward to upward. This means that in the event of a breakdown of the resistance level 13.39, the price is most likely to continue the upward movement.
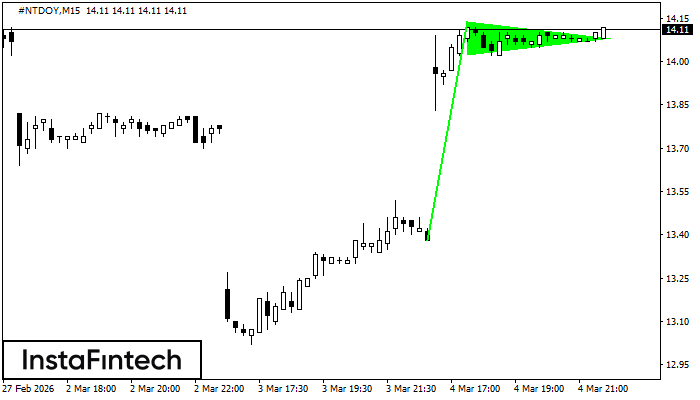
#NTDOY M15
Bullish pennant
The Bullish pennant graphic pattern has formed on the #NTDOY M15 instrument. This pattern type falls under the category of continuation patterns. In this case, if the quote can breaks out high, is expected to continue the upward trend to level 14.36.
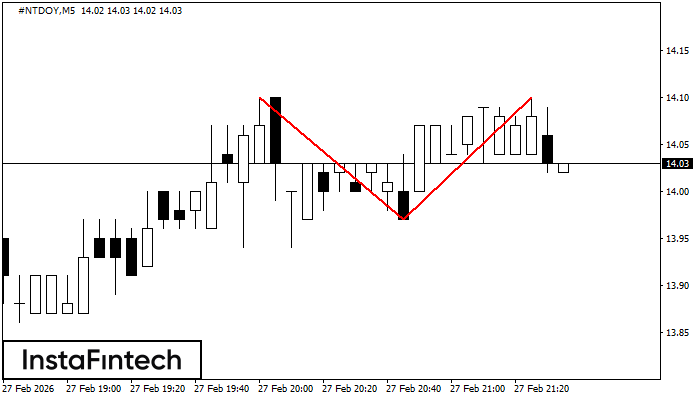
#NTDOY M5
Double Top
The Double Top pattern has been formed on #NTDOY M5. It signals that the trend has been changed from upwards to downwards. Probably, if the base of the pattern 13.97 is broken, the downward movement will continue.