 Français
  Русский
 English
 Bahasa Indonesia
 Bahasa Malay
 ไทย
ไทย Español
 Deutsch
 Български
 Tiếng Việt
 中文
中文 বাংলা
বাংলা हिन्दी
 Čeština
 Українська
 Română
FX.co ★ Patterns #MCD | McDonald's Corporation Stock Price

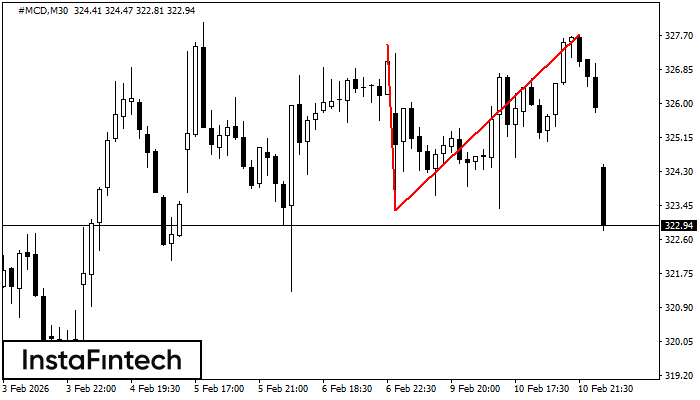
#MCD M30
Double Top
On the chart of #MCD M30 the Double Top reversal pattern has been formed. Characteristics: the upper boundary 327.74; the lower boundary 323.32; the width of the pattern 442 points. The signal: a break of the lower boundary will cause continuation of the downward trend targeting the 323.02 level.
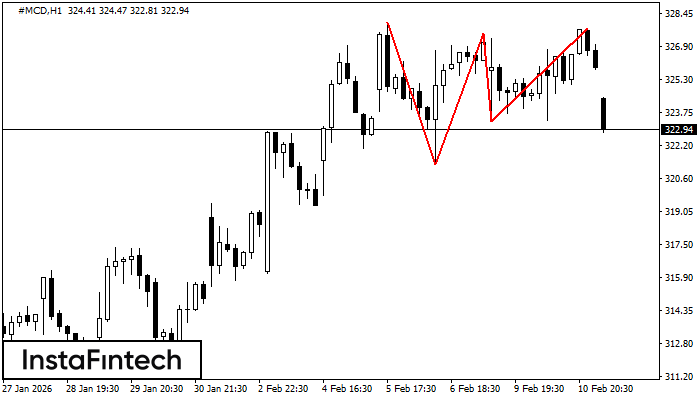
#MCD H1
Triple Top
The Triple Top pattern has formed on the chart of the #MCD H1 trading instrument. It is a reversal pattern featuring the following characteristics: resistance level 29, support level -202, and pattern’s width 673. Forecast If the price breaks through the support level 321.30, it is likely to move further down to 327.09.
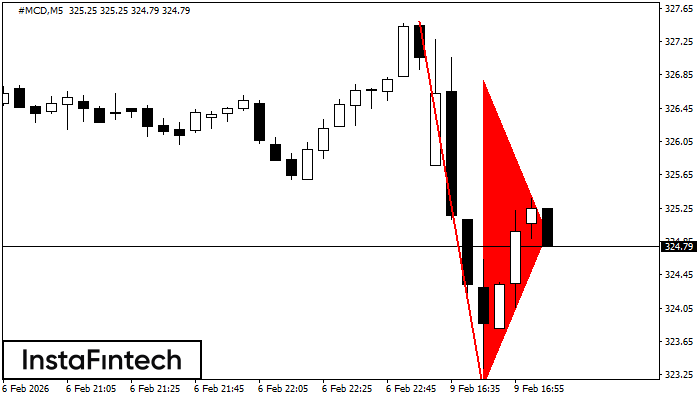
#MCD M5
Bearish pennant
The Bearish pennant pattern has formed on the #MCD M5 chart. The pattern signals continuation of the downtrend in case the pennant’s low of 323.11 is broken through. Recommendations: Place the sell stop pending order 10 pips below the pattern’s low. Place the take profit order at the projection distance of the flagpole height.
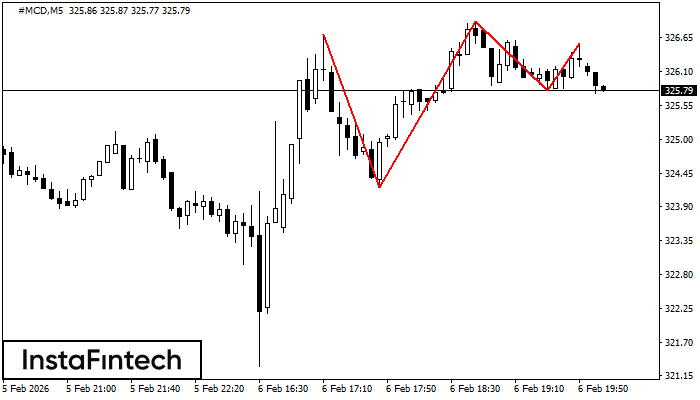
#MCD M5
Triple Top
The Triple Top pattern has formed on the chart of the #MCD M5 trading instrument. It is a reversal pattern featuring the following characteristics: resistance level 15, support level -158, and pattern’s width 248. Forecast If the price breaks through the support level 324.22, it is likely to move further down to 326.76.
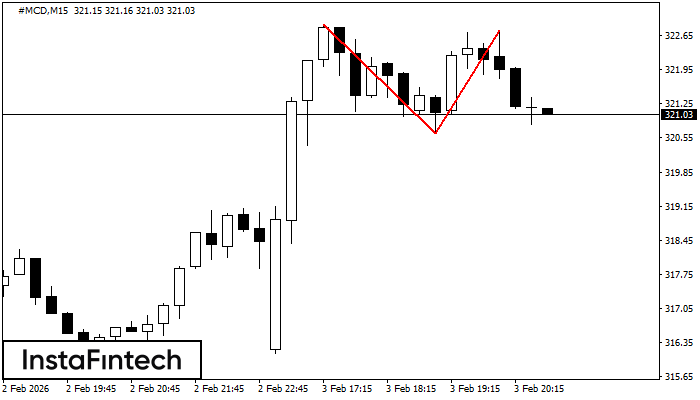
#MCD M15
Double Top
The Double Top reversal pattern has been formed on #MCD M15. Characteristics: the upper boundary 322.87; the lower boundary 320.65; the width of the pattern is 210 points. Sell trades are better to be opened below the lower boundary 320.65 with a possible movements towards the 320.42 level.
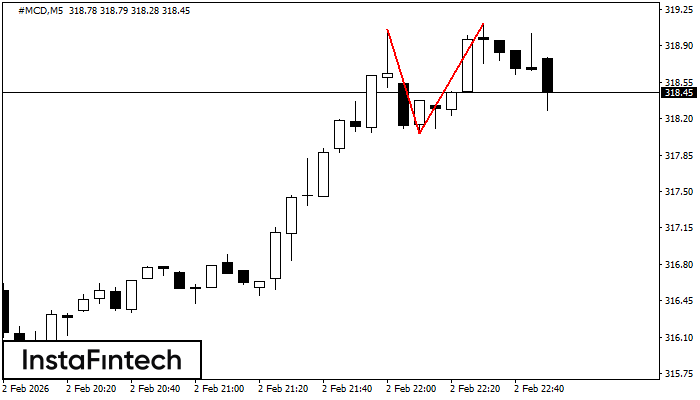
#MCD M5
Double Top
The Double Top reversal pattern has been formed on #MCD M5. Characteristics: the upper boundary 319.06; the lower boundary 318.06; the width of the pattern is 105 points. Sell trades are better to be opened below the lower boundary 318.06 with a possible movements towards the 317.91 level.
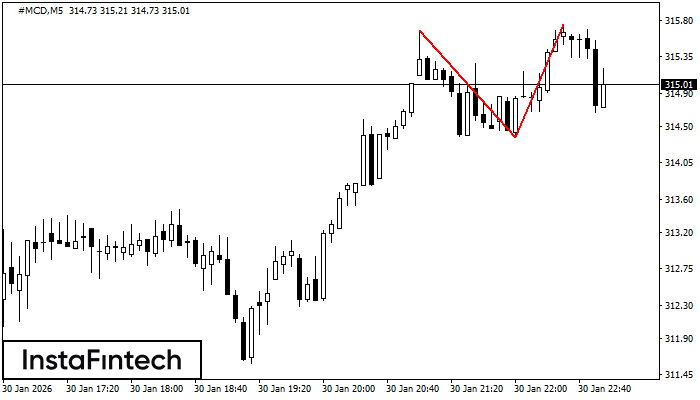
#MCD M5
Double Top
The Double Top pattern has been formed on #MCD M5. It signals that the trend has been changed from upwards to downwards. Probably, if the base of the pattern 314.36 is broken, the downward movement will continue.
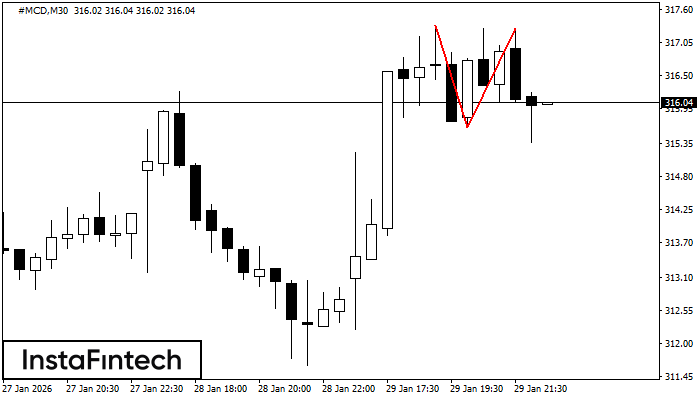
#MCD M30
Double Top
The Double Top reversal pattern has been formed on #MCD M30. Characteristics: the upper boundary 317.34; the lower boundary 315.63; the width of the pattern is 166 points. Sell trades are better to be opened below the lower boundary 315.63 with a possible movements towards the 315.33 level.
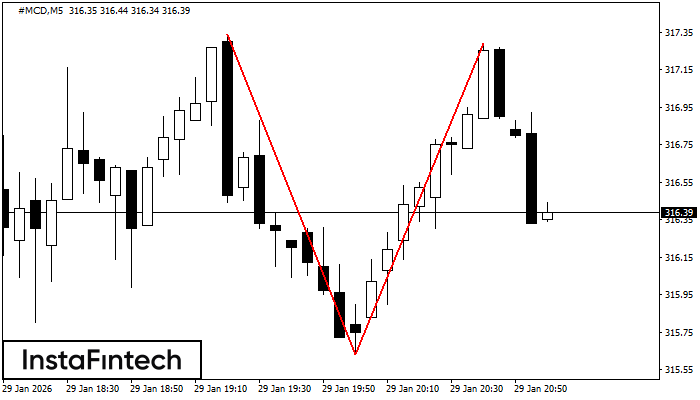
#MCD M5
Double Top
The Double Top pattern has been formed on #MCD M5. It signals that the trend has been changed from upwards to downwards. Probably, if the base of the pattern 316.07 is broken, the downward movement will continue.
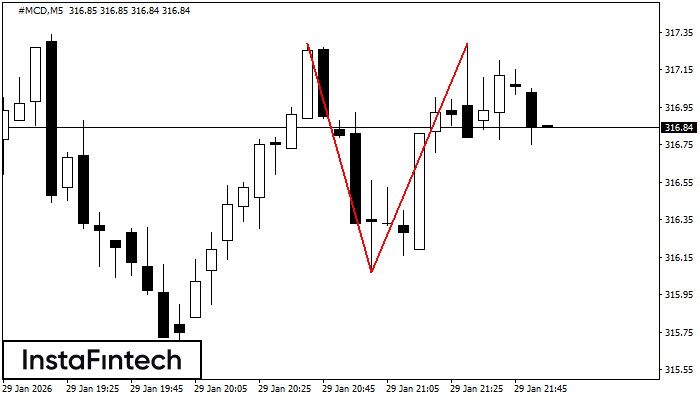
#MCD M5
Double Top
The Double Top pattern has been formed on #MCD M5. It signals that the trend has been changed from upwards to downwards. Probably, if the base of the pattern 315.63 is broken, the downward movement will continue.