 Français
  Русский
 English
 Bahasa Indonesia
 Bahasa Malay
 ไทย
ไทย Español
 Deutsch
 Български
 Tiếng Việt
 中文
中文 বাংলা
বাংলা हिन्दी
 Čeština
 Українська
 Română
FX.co ★ Patterns #MA | Mastercard IncorpoRated Stock Price

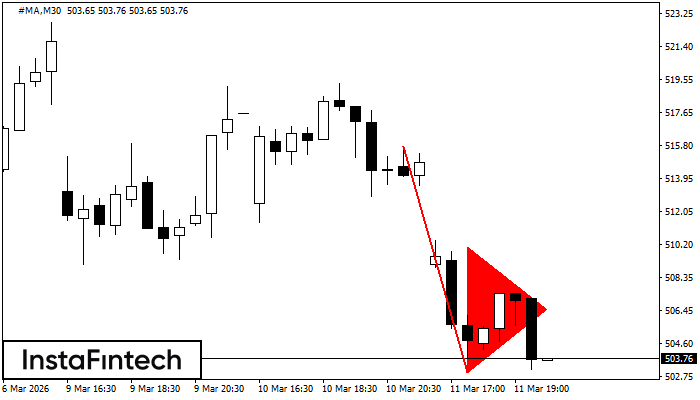
#MA M30
Bearish pennant
The Bearish pennant pattern has formed on the #MA M30 chart. The pattern signals continuation of the downtrend in case the pennant’s low of 502.97 is broken through. Recommendations: Place the sell stop pending order 10 pips below the pattern’s low. Place the take profit order at the projection distance of the flagpole height.

#MA H1
Bearish pennant
The Bearish pennant pattern has formed on the #MA H1 chart. It signals potential continuation of the existing trend. Specifications: the pattern’s bottom has the coordinate of 503.17; the projection of the flagpole height is equal to 1611 pips. In case the price breaks out the pattern’s bottom of 503.17, the downtrend is expected to continue for further level 502.77.
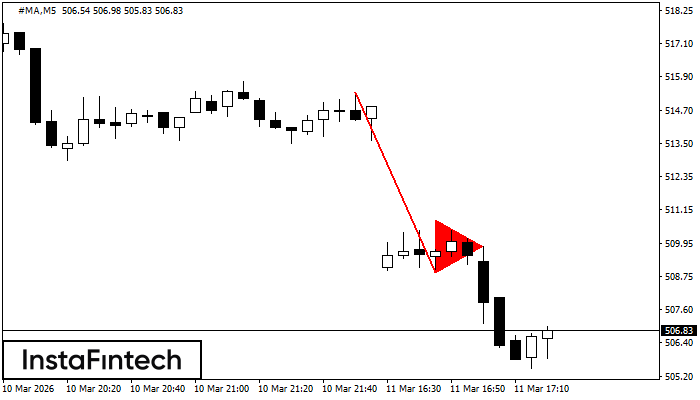
#MA M5
Bearish pennant
The Bearish pennant pattern has formed on the #MA M5 chart. This pattern type is characterized by a slight slowdown after which the price will move in the direction of the original trend. In case the price fixes below the pattern’s low of 508.90, a trader will be able to successfully enter the sell position.
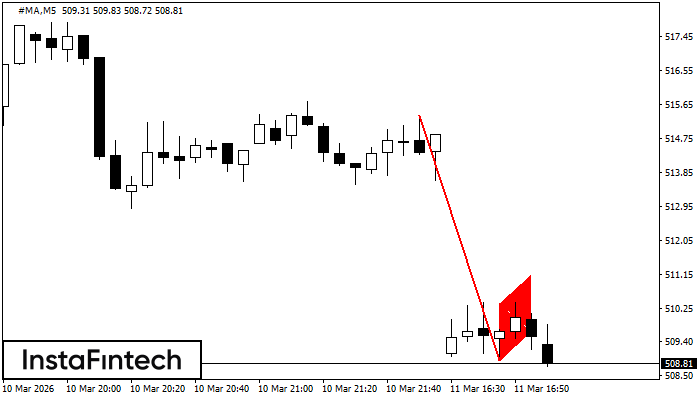
#MA M5
Bearish Flag
The Bearish Flag pattern has been formed on #MA at M5. The lower boundary of the pattern is located at 508.90/509.66 while the upper boundary lies at 510.40/511.16. The projection of the flagpole is 645 points. This formation signals that the downward trend is most likely to continue. Therefore, if the level of 508.90 is broken, the price will move further downwards.
#MA M5
Double Top
The Double Top reversal pattern has been formed on #MA M5. Characteristics: the upper boundary 519.11; the lower boundary 511.44; the width of the pattern is 784 points. Sell trades are better to be opened below the lower boundary 511.44 with a possible movements towards the 511.29 level.
#MA M30
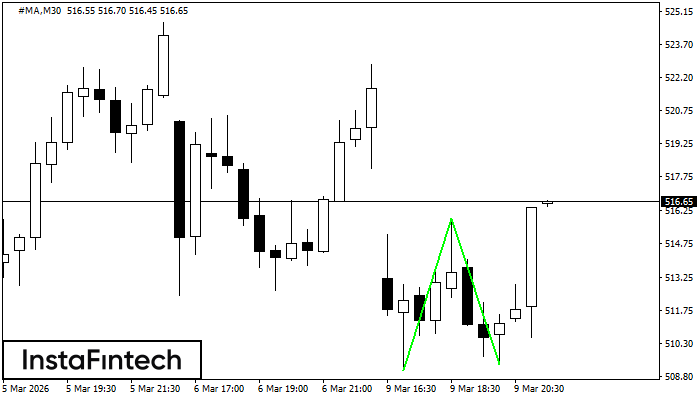
Double Bottom
The Double Bottom pattern has been formed on #MA M30. This formation signals a reversal of the trend from downwards to upwards. The signal is that a buy trade should be opened after the upper boundary of the pattern 515.90 is broken. The further movements will rely on the width of the current pattern 680 points.
#MA M15
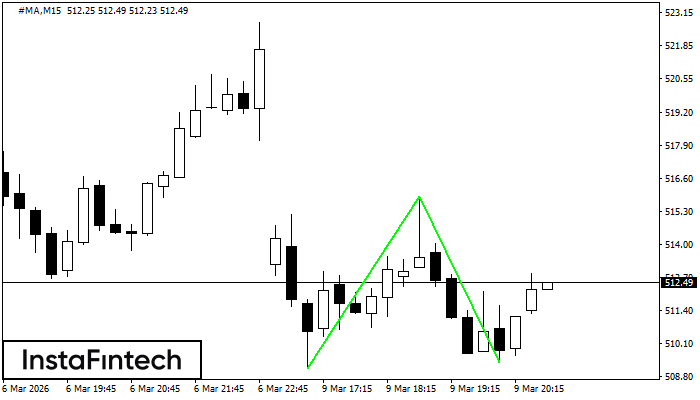
Double Bottom
The Double Bottom pattern has been formed on #MA M15; the upper boundary is 515.90; the lower boundary is 509.37. The width of the pattern is 680 points. In case of a break of the upper boundary 515.90, a change in the trend can be predicted where the width of the pattern will coincide with the distance to a possible take profit level.
#MA M5
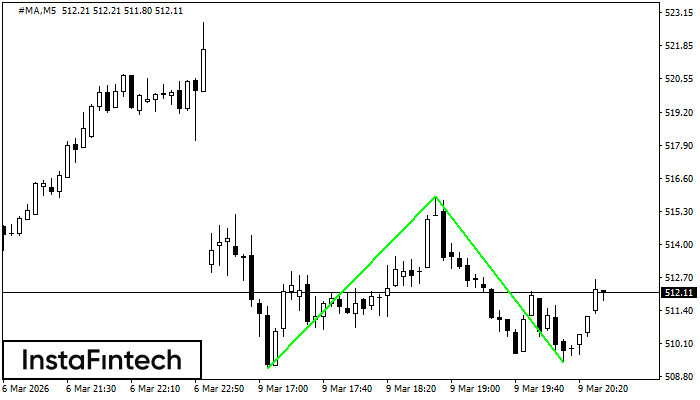
Double Bottom
The Double Bottom pattern has been formed on #MA M5. This formation signals a reversal of the trend from downwards to upwards. The signal is that a buy trade should be opened after the upper boundary of the pattern 515.90 is broken. The further movements will rely on the width of the current pattern 680 points.
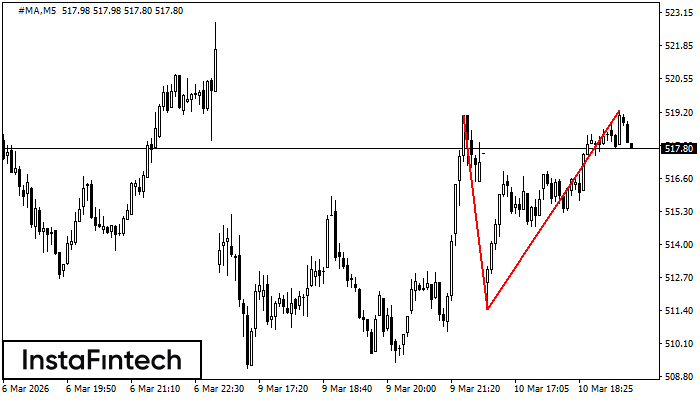
#MA M5
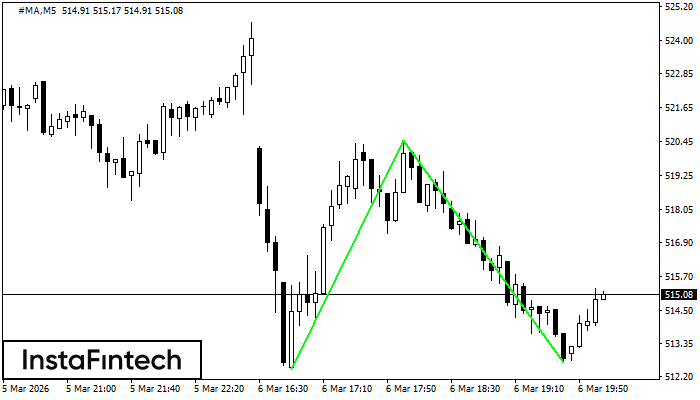
Double Bottom
The Double Bottom pattern has been formed on #MA M5; the upper boundary is 520.49; the lower boundary is 512.68. The width of the pattern is 806 points. In case of a break of the upper boundary 520.49, a change in the trend can be predicted where the width of the pattern will coincide with the distance to a possible take profit level.
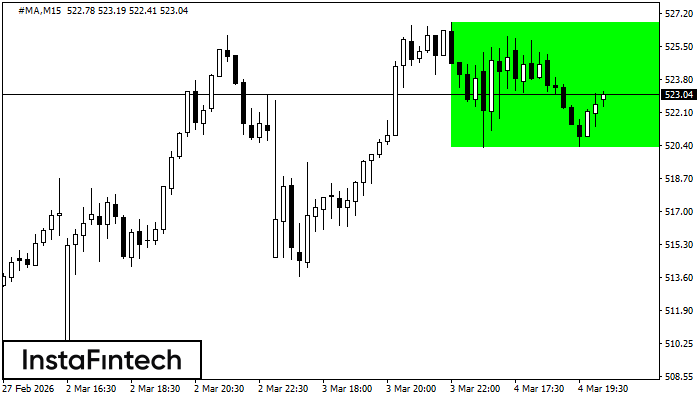
#MA M15
Bullish Rectangle
According to the chart of M15, #MA formed the Bullish Rectangle. This type of a pattern indicates a trend continuation. It consists of two levels: resistance 526.76 and support 520.31. In case the resistance level 526.76 - 526.76 is broken, the instrument is likely to follow the bullish trend.