 Français
  Русский
 English
 Bahasa Indonesia
 Bahasa Malay
 ไทย
ไทย Español
 Deutsch
 Български
 Tiếng Việt
 中文
中文 বাংলা
বাংলা हिन्दी
 Čeština
 Українська
 Română
FX.co ★ Patterns GOLD | Taux de l'or sur le marché Forex

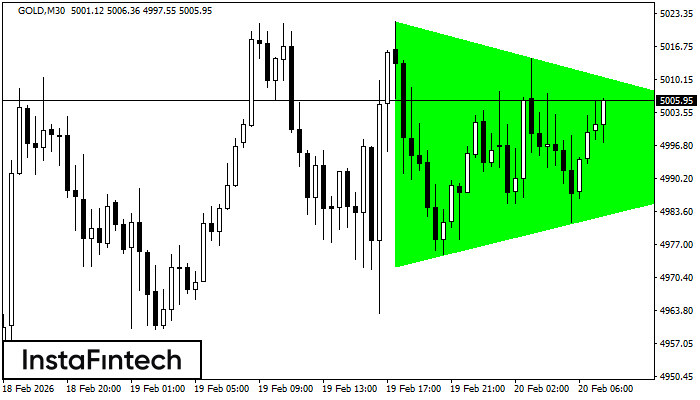
GOLD M30
Bullish Symmetrical Triangle
According to the chart of M30, GOLD formed the Bullish Symmetrical Triangle pattern, which signals the trend will continue. Description. The upper border of the pattern touches the coordinates 5021.73/4996.17 whereas the lower border goes across 4972.62/4996.17. The pattern width is measured on the chart at 4911 pips. If the Bullish Symmetrical Triangle pattern is in progress during the upward trend, this indicates the current trend will go on. In case 4996.17 is broken, the price could continue its move toward 4996.47.
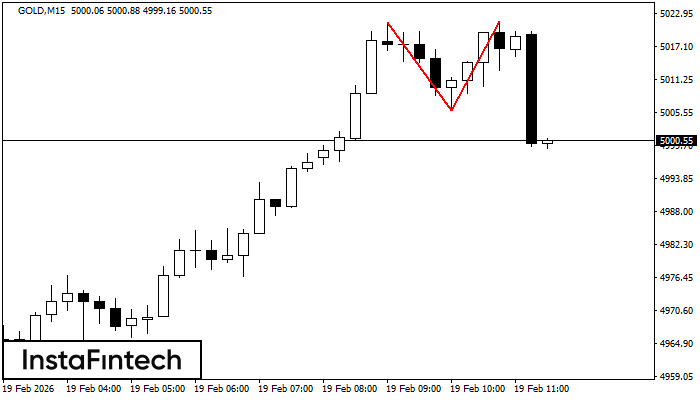
GOLD M15
Double Top
On the chart of GOLD M15 the Double Top reversal pattern has been formed. Characteristics: the upper boundary 5021.46; the lower boundary 5005.88; the width of the pattern 1558 points. The signal: a break of the lower boundary will cause continuation of the downward trend targeting the 5005.65 level.
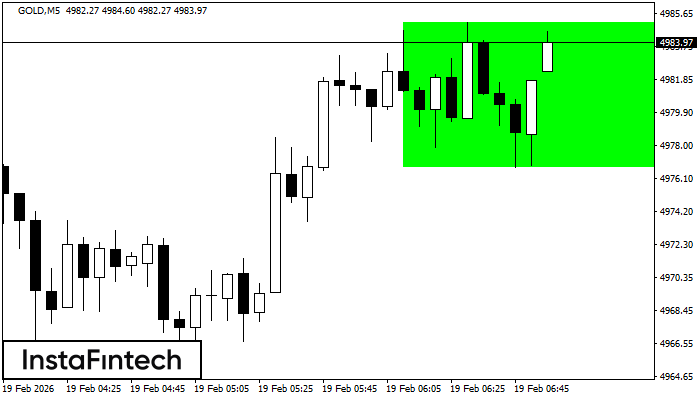
GOLD M5
Bullish Rectangle
According to the chart of M5, GOLD formed the Bullish Rectangle. This type of a pattern indicates a trend continuation. It consists of two levels: resistance 4985.11 and support 4976.72. In case the resistance level 4985.11 - 4985.11 is broken, the instrument is likely to follow the bullish trend.
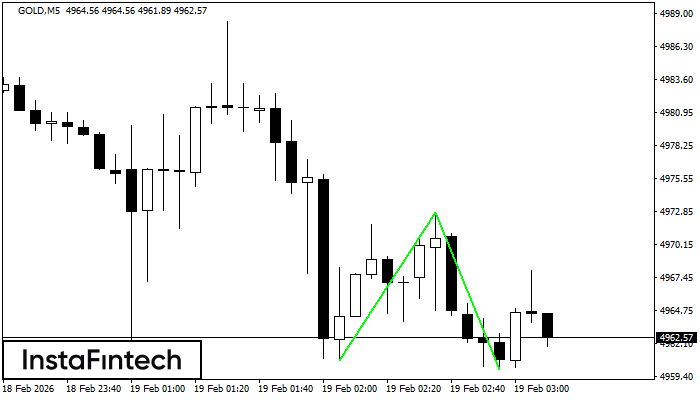
GOLD M5
Double Bottom
The Double Bottom pattern has been formed on GOLD M5. Characteristics: the support level 4960.71; the resistance level 4972.82; the width of the pattern 1211 points. If the resistance level is broken, a change in the trend can be predicted with the first target point lying at the distance of 1287 points.
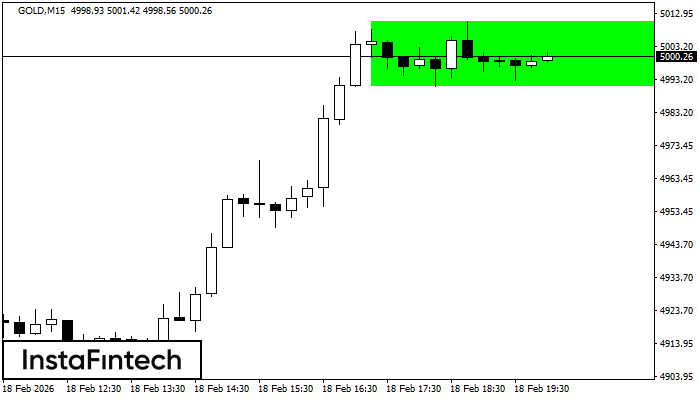
GOLD M15
Bullish Rectangle
According to the chart of M15, GOLD formed the Bullish Rectangle. This type of a pattern indicates a trend continuation. It consists of two levels: resistance 5010.57 and support 4991.00. In case the resistance level 5010.57 - 5010.57 is broken, the instrument is likely to follow the bullish trend.
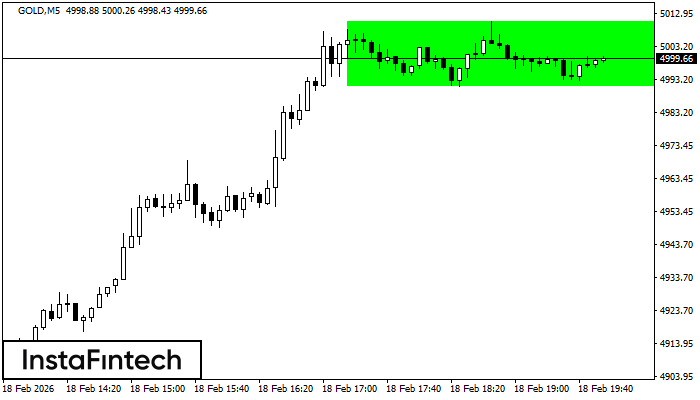
GOLD M5
Bullish Rectangle
According to the chart of M5, GOLD formed the Bullish Rectangle. The pattern indicates a trend continuation. The upper border is 5010.57, the lower border is 4991.00. The signal means that a long position should be opened above the upper border 5010.57 of the Bullish Rectangle.
GOLD M5
Double Top
The Double Top reversal pattern has been formed on GOLD M5. Characteristics: the upper boundary 4939.52; the lower boundary 4929.42; the width of the pattern is 990 points. Sell trades are better to be opened below the lower boundary 4929.42 with a possible movements towards the 4929.27 level.
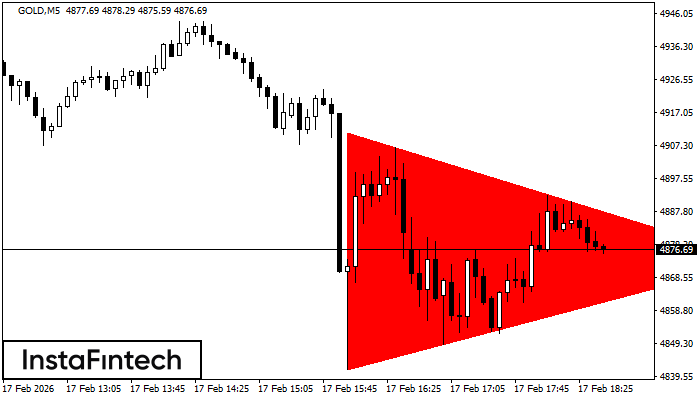
GOLD M5
Bearish Symmetrical Triangle
According to the chart of M5, GOLD formed the Bearish Symmetrical Triangle pattern. This pattern signals a further downward trend in case the lower border 4841.44 is breached. Here, a hypothetical profit will equal the width of the available pattern that is -6953 pips.
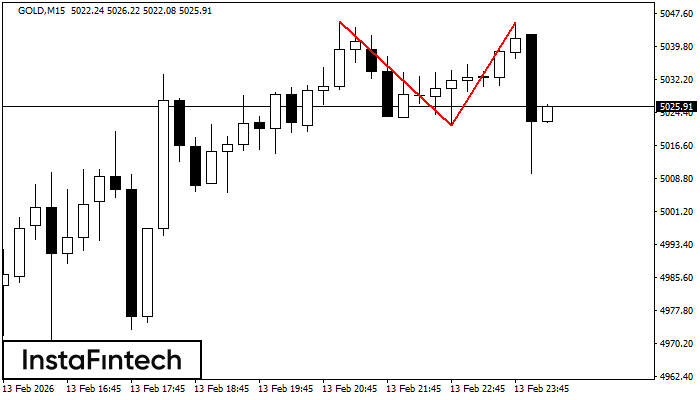
GOLD M15
Double Top
On the chart of GOLD M15 the Double Top reversal pattern has been formed. Characteristics: the upper boundary 5045.59; the lower boundary 5021.27; the width of the pattern 2432 points. The signal: a break of the lower boundary will cause continuation of the downward trend targeting the 5021.04 level.
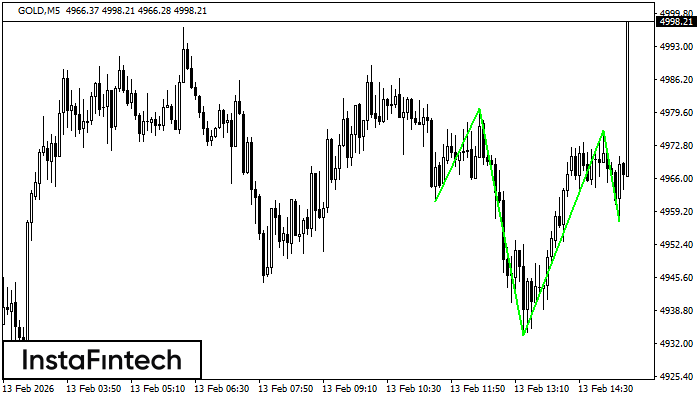
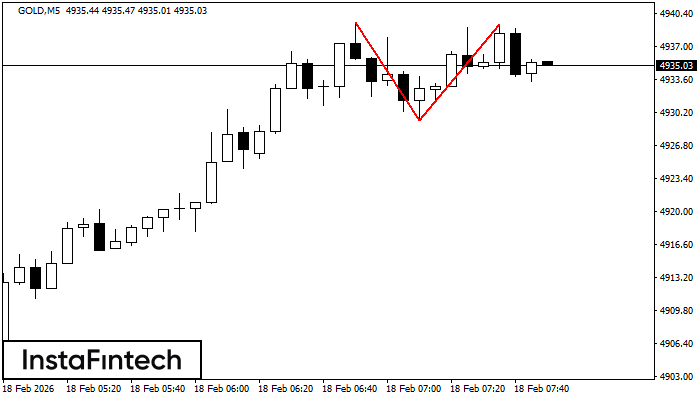
GOLD M5
Inverse Head and Shoulder
According to the chart of M5, GOLD produced the pattern termed the Inverse Head and Shoulder. The Head is fixed at 4933.64 while the median line of the Neck is set at 4980.25/4975.86. The formation of the Inverse Head and Shoulder Pattern clearly indicates a reversal of the downward trend. In means that in case the scenario comes true, the price of GOLD will go towards 4976.01.