 Français
  Русский
 English
 Bahasa Indonesia
 Bahasa Malay
 ไทย
ไทย Español
 Deutsch
 Български
 Tiếng Việt
 中文
中文 বাংলা
বাংলা हिन्दी
 Čeština
 Українська
 Română
FX.co ★ Patterns GBPCHF | British Pound (GBP) to Swiss Franc (CHF) Rate in the Forex market

GBPCHF M5
Double Top
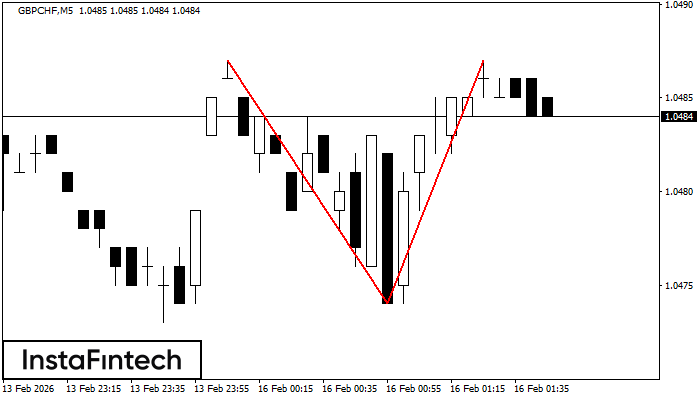
On the chart of GBPCHF M5 the Double Top reversal pattern has been formed. Characteristics: the upper boundary 1.0487; the lower boundary 1.0474; the width of the pattern 13 points. The signal: a break of the lower boundary will cause continuation of the downward trend targeting the 1.0459 level.
GBPCHF M5
Triple Top
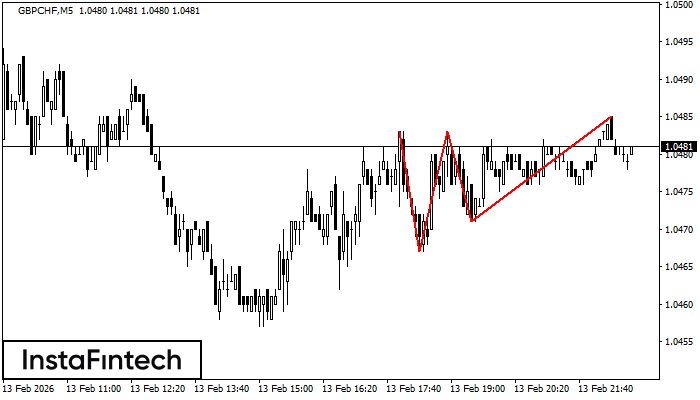
On the chart of the GBPCHF M5 trading instrument, the Triple Top pattern that signals a trend change has formed. It is possible that after formation of the third peak, the price will try to break through the resistance level 1.0467, where we advise to open a trading position for sale. Take profit is the projection of the pattern’s width, which is 16 points.
GBPCHF M5
Double Bottom
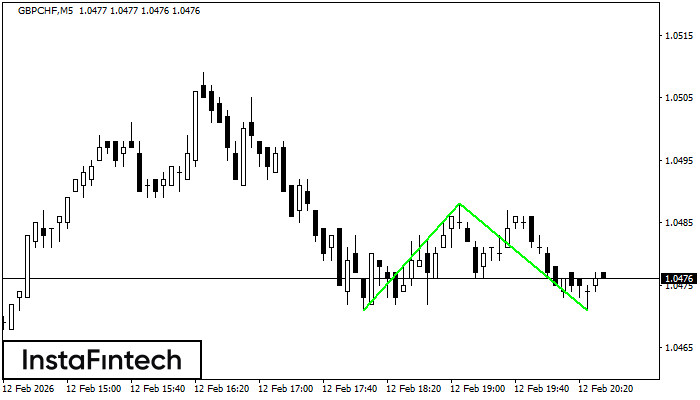
The Double Bottom pattern has been formed on GBPCHF M5; the upper boundary is 1.0488; the lower boundary is 1.0471. The width of the pattern is 17 points. In case of a break of the upper boundary 1.0488, a change in the trend can be predicted where the width of the pattern will coincide with the distance to a possible take profit level.
GBPCHF M15
Triple Bottom
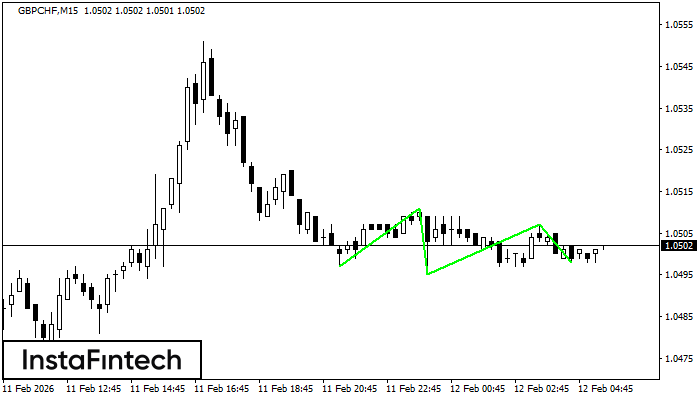
The Triple Bottom pattern has formed on the chart of GBPCHF M15. Features of the pattern: The lower line of the pattern has coordinates 1.0511 with the upper limit 1.0511/1.0507, the projection of the width is 14 points. The formation of the Triple Bottom pattern most likely indicates a change in the trend from downward to upward. This means that in the event of a breakdown of the resistance level 1.0497, the price is most likely to continue the upward movement.
GBPCHF M15
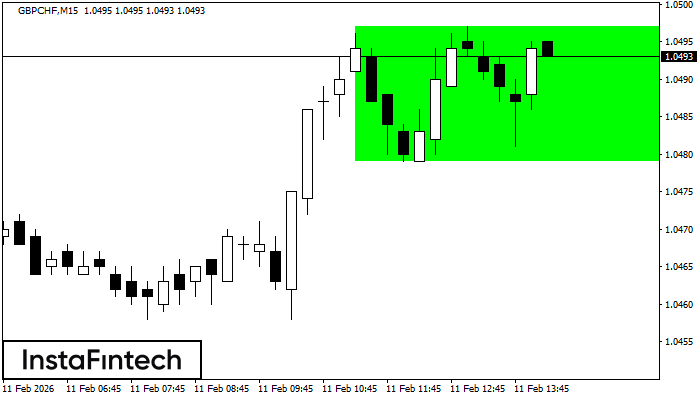
Bullish Rectangle
According to the chart of M15, GBPCHF formed the Bullish Rectangle which is a pattern of a trend continuation. The pattern is contained within the following borders: the lower border 1.0479 – 1.0479 and upper border 1.0497 – 1.0497. In case the upper border is broken, the instrument is likely to follow the upward trend.
GBPCHF M5
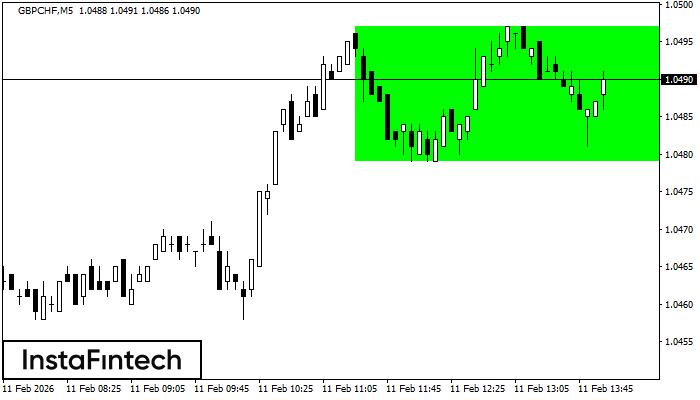
Bullish Rectangle
According to the chart of M5, GBPCHF formed the Bullish Rectangle which is a pattern of a trend continuation. The pattern is contained within the following borders: the lower border 1.0479 – 1.0479 and upper border 1.0497 – 1.0497. In case the upper border is broken, the instrument is likely to follow the upward trend.
GBPCHF M15
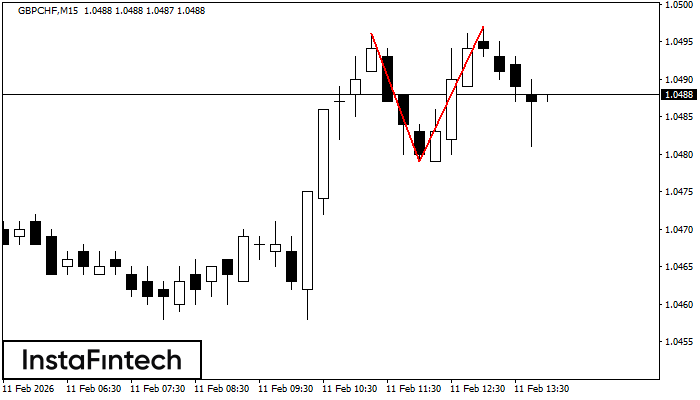
Double Top
On the chart of GBPCHF M15 the Double Top reversal pattern has been formed. Characteristics: the upper boundary 1.0497; the lower boundary 1.0479; the width of the pattern 18 points. The signal: a break of the lower boundary will cause continuation of the downward trend targeting the 1.0457 level.
GBPCHF M5
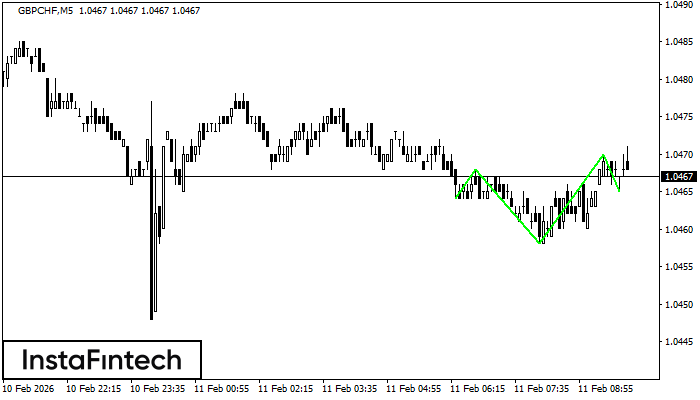
Inverse Head and Shoulder
According to the chart of M5, GBPCHF formed the Inverse Head and Shoulder pattern. The Head’s top is set at 1.0470 while the median line of the Neck is found at 1.0458/1.0465. The formation of the Inverse Head and Shoulder pattern evidently signals a reversal of the downward trend. In other words, in case the scenario comes true, the price of GBPCHF will go towards 1.0485
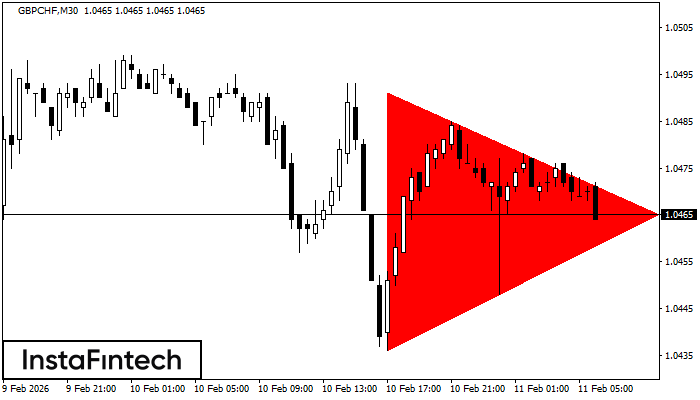
GBPCHF M30
Bearish Symmetrical Triangle
According to the chart of M30, GBPCHF formed the Bearish Symmetrical Triangle pattern. Trading recommendations: A breach of the lower border 1.0436 is likely to encourage a continuation of the downward trend.
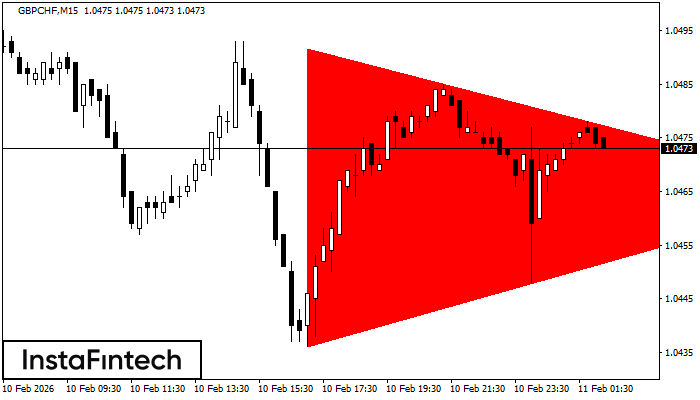
GBPCHF M15
Bearish Symmetrical Triangle
According to the chart of M15, GBPCHF formed the Bearish Symmetrical Triangle pattern. This pattern signals a further downward trend in case the lower border 1.0436 is breached. Here, a hypothetical profit will equal the width of the available pattern that is -56 pips.