 Français
  Русский
 English
 Bahasa Indonesia
 Bahasa Malay
 ไทย
ไทย Español
 Deutsch
 Български
 Tiếng Việt
 中文
中文 বাংলা
বাংলা हिन्दी
 Čeština
 Українська
 Română
FX.co ★ Patterns AUDUSD | Australian Dollar (AUD) to US Dollar (USD) Rate in the Forex market

AUDUSD M5
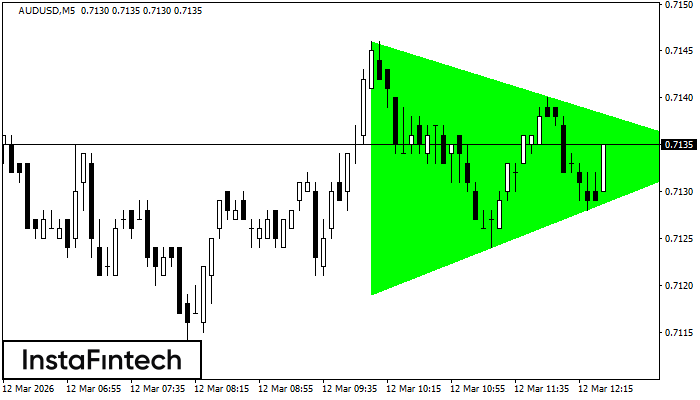
Bullish Symmetrical Triangle
According to the chart of M5, AUDUSD formed the Bullish Symmetrical Triangle pattern. Description: This is the pattern of a trend continuation. 0.7146 and 0.7119 are the coordinates of the upper and lower borders respectively. The pattern width is measured on the chart at 27 pips. Outlook: If the upper border 0.7146 is broken, the price is likely to continue its move by 0.7149.
AUDUSD M5
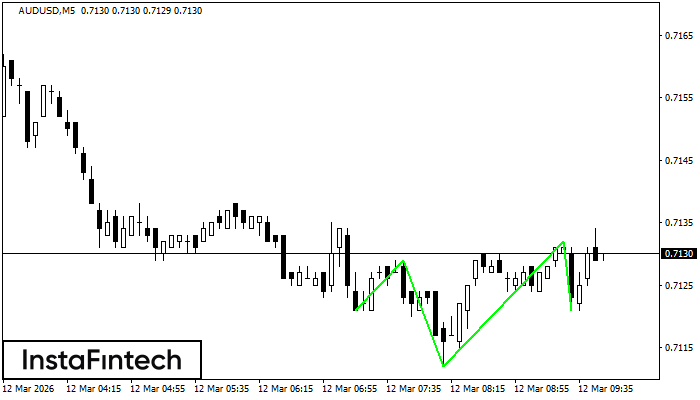
Inverse Head and Shoulder
According to the chart of M5, AUDUSD formed the Inverse Head and Shoulder pattern. The Head’s top is set at 0.7132 while the median line of the Neck is found at 0.7112/0.7121. The formation of the Inverse Head and Shoulder pattern evidently signals a reversal of the downward trend. In other words, in case the scenario comes true, the price of AUDUSD will go towards 0.7147
AUDUSD H1
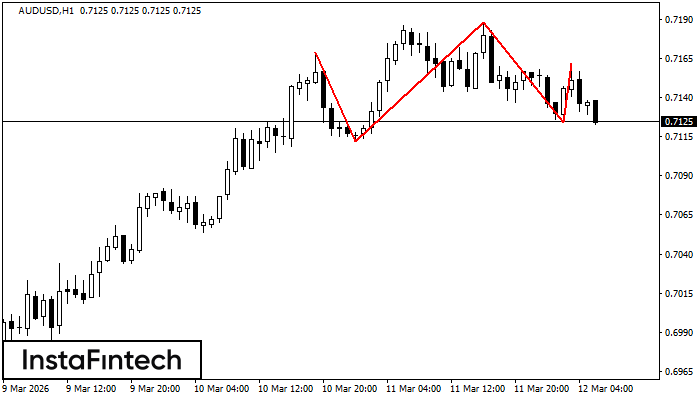
Head and Shoulders
The AUDUSD H1 formed the Head and Shoulders pattern with the following features: The Head’s top is at 0.7188, the Neckline and the upward angle are at 0.7112/0.7124. The formation of this pattern can bring about changes in the current trend from bullish to bearish. In case the pattern triggers the expected changes, the price of AUDUSD will go towards 0.7084.
AUDUSD H1
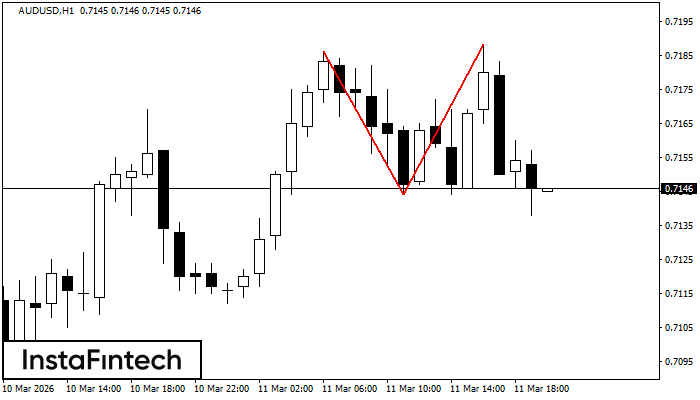
Double Top
On the chart of AUDUSD H1 the Double Top reversal pattern has been formed. Characteristics: the upper boundary 0.7188; the lower boundary 0.7144; the width of the pattern 44 points. The signal: a break of the lower boundary will cause continuation of the downward trend targeting the 0.7104 level.
AUDUSD H1
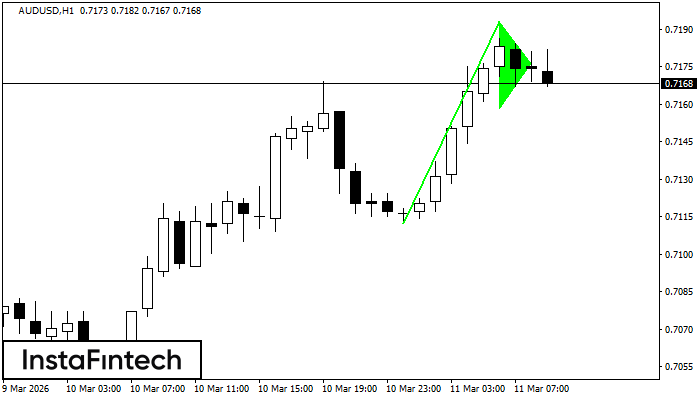
Bullish pennant
The Bullish pennant graphic pattern has formed on the AUDUSD H1 instrument. This pattern type falls under the category of continuation patterns. In this case, if the quote can breaks out high, is expected to continue the upward trend to level 0.7233.
AUDUSD M5
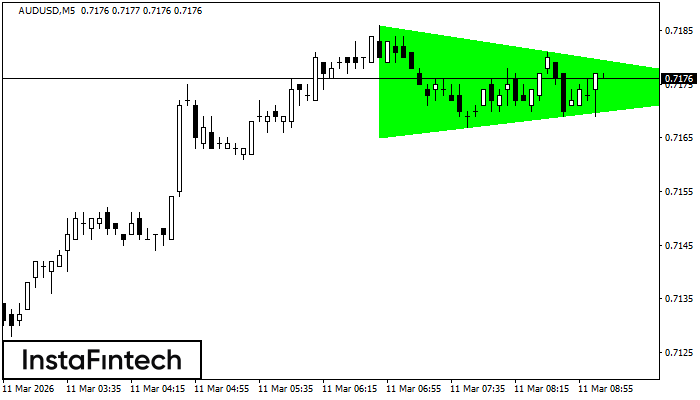
Bullish Symmetrical Triangle
According to the chart of M5, AUDUSD formed the Bullish Symmetrical Triangle pattern. Description: This is the pattern of a trend continuation. 0.7186 and 0.7165 are the coordinates of the upper and lower borders respectively. The pattern width is measured on the chart at 21 pips. Outlook: If the upper border 0.7186 is broken, the price is likely to continue its move by 0.7189.
AUDUSD M15
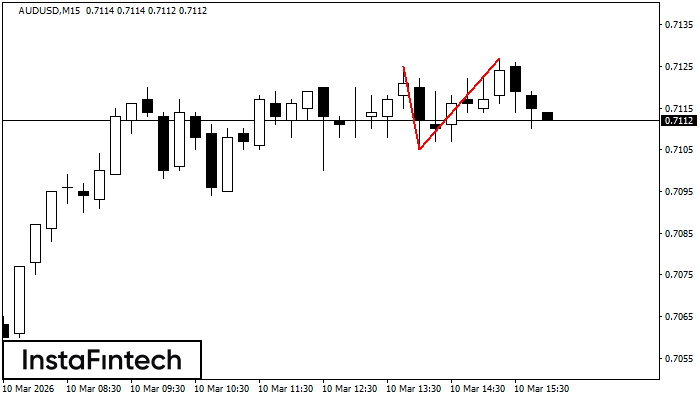
Double Top
On the chart of AUDUSD M15 the Double Top reversal pattern has been formed. Characteristics: the upper boundary 0.7127; the lower boundary 0.7105; the width of the pattern 22 points. The signal: a break of the lower boundary will cause continuation of the downward trend targeting the 0.7082 level.
AUDUSD M5
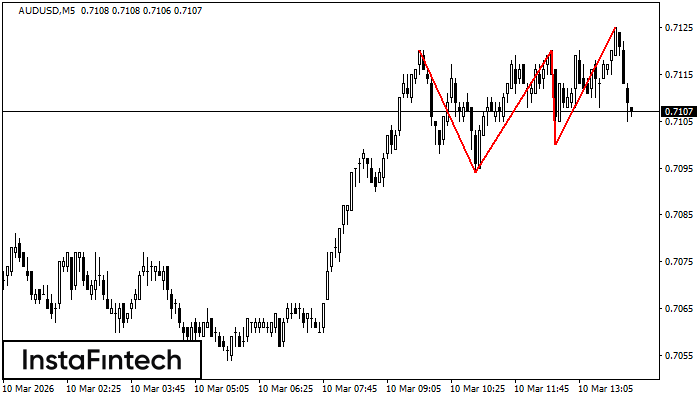
Triple Top
On the chart of the AUDUSD M5 trading instrument, the Triple Top pattern that signals a trend change has formed. It is possible that after formation of the third peak, the price will try to break through the resistance level 0.7094, where we advise to open a trading position for sale. Take profit is the projection of the pattern’s width, which is 26 points.
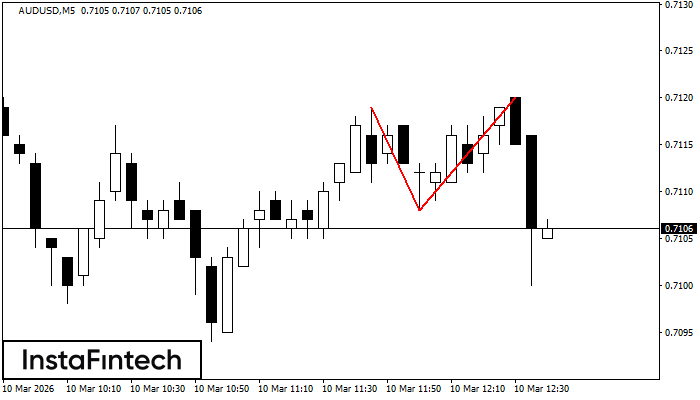
AUDUSD M5
Double Top
On the chart of AUDUSD M5 the Double Top reversal pattern has been formed. Characteristics: the upper boundary 0.7120; the lower boundary 0.7108; the width of the pattern 12 points. The signal: a break of the lower boundary will cause continuation of the downward trend targeting the 0.7093 level.
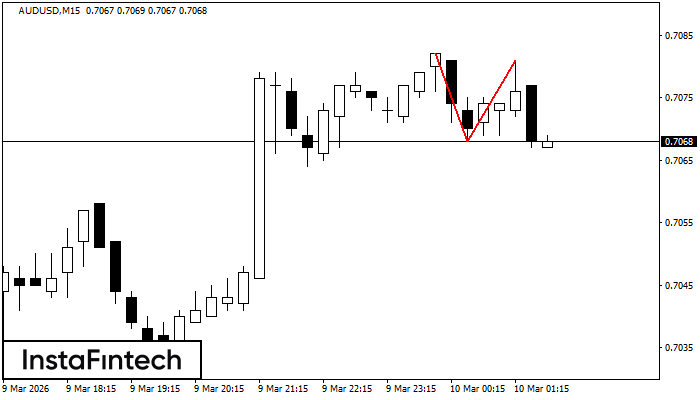
AUDUSD M15
Double Top
The Double Top reversal pattern has been formed on AUDUSD M15. Characteristics: the upper boundary 0.7082; the lower boundary 0.7068; the width of the pattern is 13 points. Sell trades are better to be opened below the lower boundary 0.7068 with a possible movements towards the 0.7046 level.