 Français
  Русский
 English
 Bahasa Indonesia
 Bahasa Malay
 ไทย
ไทย Español
 Deutsch
 Български
 Tiếng Việt
 中文
中文 বাংলা
বাংলা हिन्दी
 Čeština
 Українська
 Română
FX.co ★ Patterns AUDJPY | Australian Dollar (AUD) to Japanese Yen (JPY) Rate in the Forex market

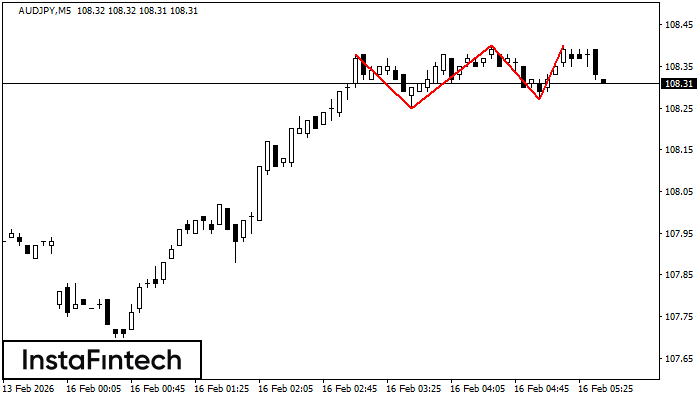
AUDJPY M5
Triple Top
The Triple Top pattern has formed on the chart of the AUDJPY M5 trading instrument. It is a reversal pattern featuring the following characteristics: resistance level -2, support level -2, and pattern’s width 13. Forecast If the price breaks through the support level 108.25, it is likely to move further down to 108.25.
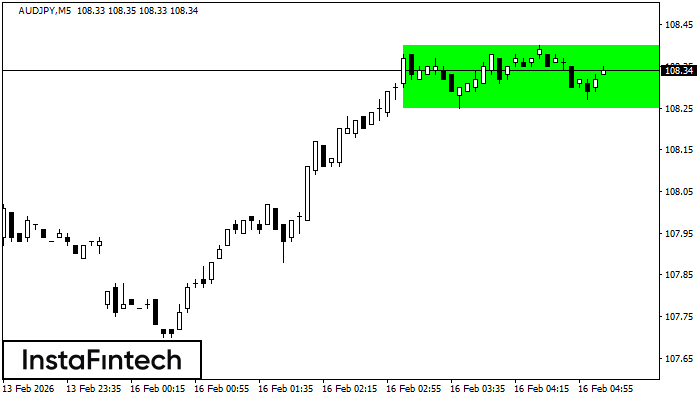
AUDJPY M5
Bullish Rectangle
According to the chart of M5, AUDJPY formed the Bullish Rectangle which is a pattern of a trend continuation. The pattern is contained within the following borders: the lower border 108.25 – 108.25 and upper border 108.40 – 108.40. In case the upper border is broken, the instrument is likely to follow the upward trend.
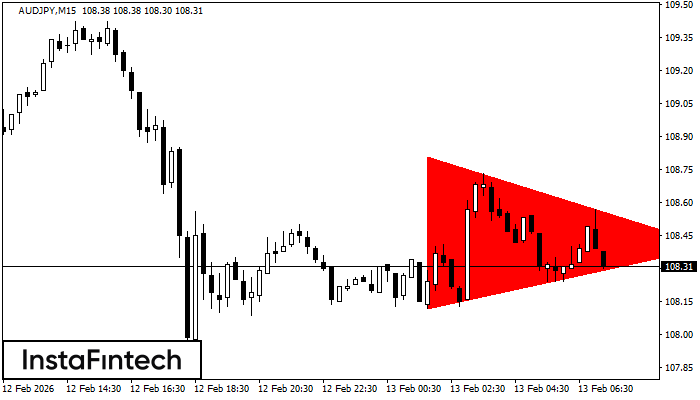
AUDJPY M15
Bearish Symmetrical Triangle
According to the chart of M15, AUDJPY formed the Bearish Symmetrical Triangle pattern. This pattern signals a further downward trend in case the lower border 108.12 is breached. Here, a hypothetical profit will equal the width of the available pattern that is -69 pips.
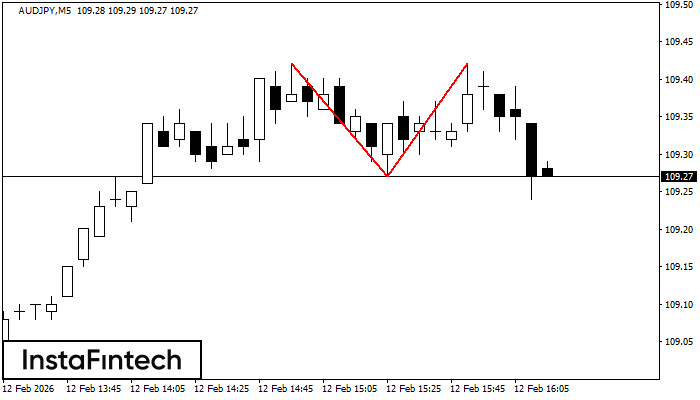
AUDJPY M5
Double Top
The Double Top reversal pattern has been formed on AUDJPY M5. Characteristics: the upper boundary 109.42; the lower boundary 109.27; the width of the pattern is 15 points. Sell trades are better to be opened below the lower boundary 109.27 with a possible movements towards the 109.12 level.
AUDJPY M5
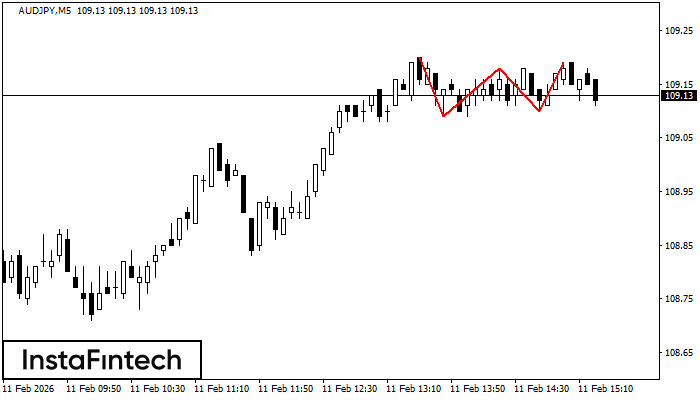
Triple Top
The Triple Top pattern has formed on the chart of the AUDJPY M5. Features of the pattern: borders have an ascending angle; the lower line of the pattern has the coordinates 109.09/109.10 with the upper limit 109.20/109.19; the projection of the width is 11 points. The formation of the Triple Top figure most likely indicates a change in the trend from upward to downward. This means that in the event of a breakdown of the support level of 109.09, the price is most likely to continue the downward movement.
AUDJPY M5
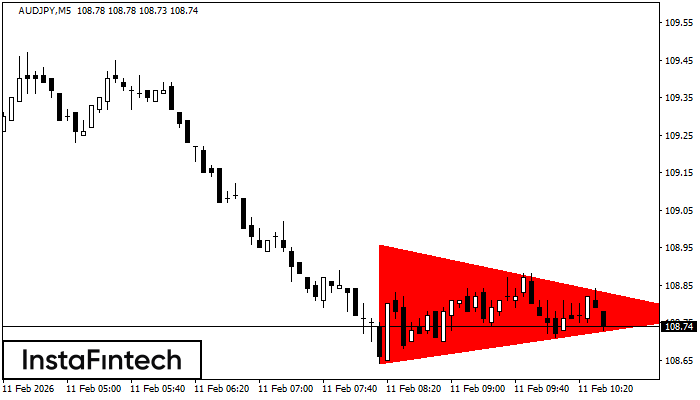
Bearish Symmetrical Triangle
According to the chart of M5, AUDJPY formed the Bearish Symmetrical Triangle pattern. Description: The lower border is 108.64/108.77 and upper border is 108.96/108.77. The pattern width is measured on the chart at -32 pips. The formation of the Bearish Symmetrical Triangle pattern evidently signals a continuation of the downward trend. In other words, if the scenario comes true and AUDJPY breaches the lower border, the price could continue its move toward 108.62.
AUDJPY M30
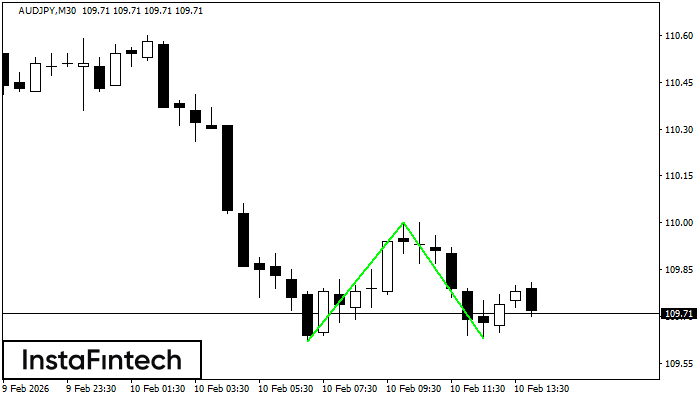
Double Bottom
The Double Bottom pattern has been formed on AUDJPY M30. This formation signals a reversal of the trend from downwards to upwards. The signal is that a buy trade should be opened after the upper boundary of the pattern 110.00 is broken. The further movements will rely on the width of the current pattern 38 points.
AUDJPY M15
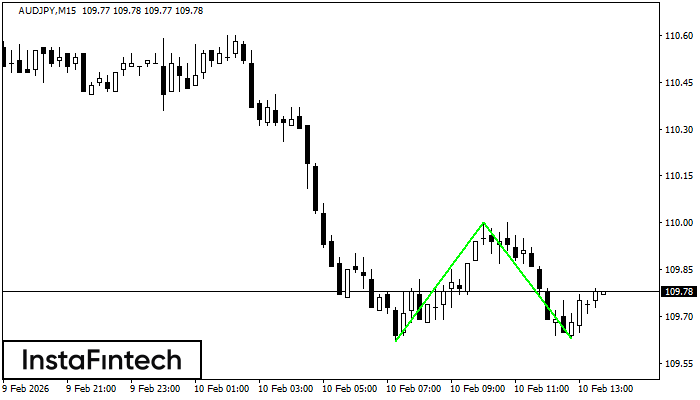
Double Bottom
The Double Bottom pattern has been formed on AUDJPY M15; the upper boundary is 110.00; the lower boundary is 109.63. The width of the pattern is 38 points. In case of a break of the upper boundary 110.00, a change in the trend can be predicted where the width of the pattern will coincide with the distance to a possible take profit level.
AUDJPY M5
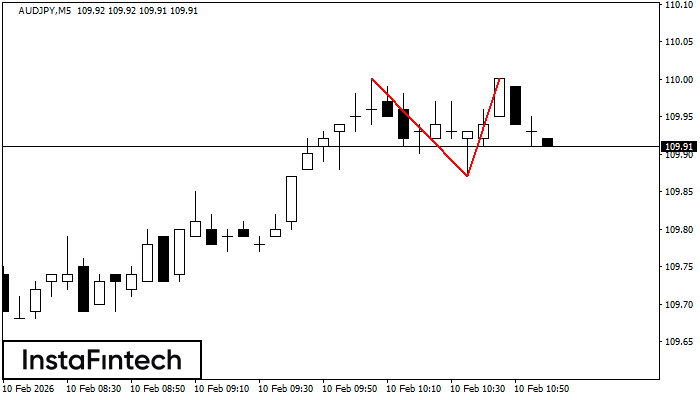
Double Top
On the chart of AUDJPY M5 the Double Top reversal pattern has been formed. Characteristics: the upper boundary 110.00; the lower boundary 109.87; the width of the pattern 13 points. The signal: a break of the lower boundary will cause continuation of the downward trend targeting the 109.72 level.
AUDJPY M30
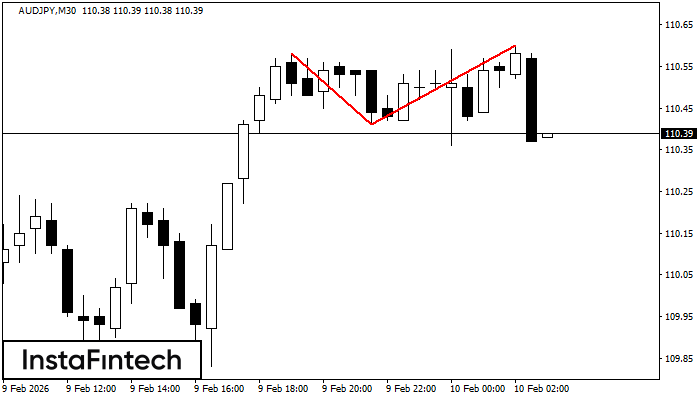
Double Top
The Double Top reversal pattern has been formed on AUDJPY M30. Characteristics: the upper boundary 110.58; the lower boundary 110.41; the width of the pattern is 19 points. Sell trades are better to be opened below the lower boundary 110.41 with a possible movements towards the 110.11 level.