 Français
  Русский
 English
 Bahasa Indonesia
 Bahasa Malay
 ไทย
ไทย Español
 Deutsch
 Български
 Tiếng Việt
 中文
中文 বাংলা
বাংলা हिन्दी
 Čeština
 Українська
 Română
FX.co ★ Patterns AUDCHF | Australian Dollar (AUD) to Swiss Franc (CHF) Rate in the Forex market

AUDCHF M30
Double Top
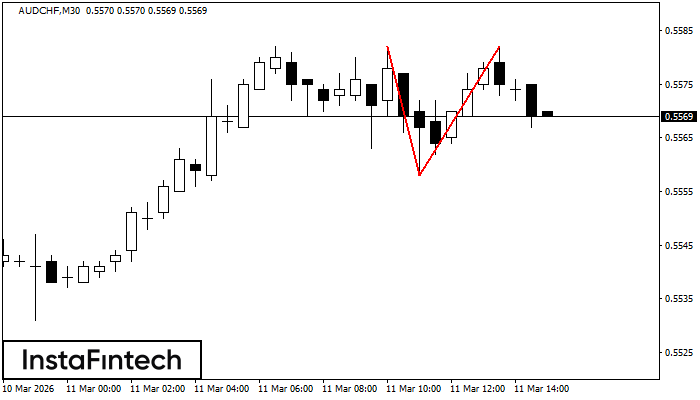
The Double Top pattern has been formed on AUDCHF M30. It signals that the trend has been changed from upwards to downwards. Probably, if the base of the pattern 0.5558 is broken, the downward movement will continue.
AUDCHF M15
Double Top
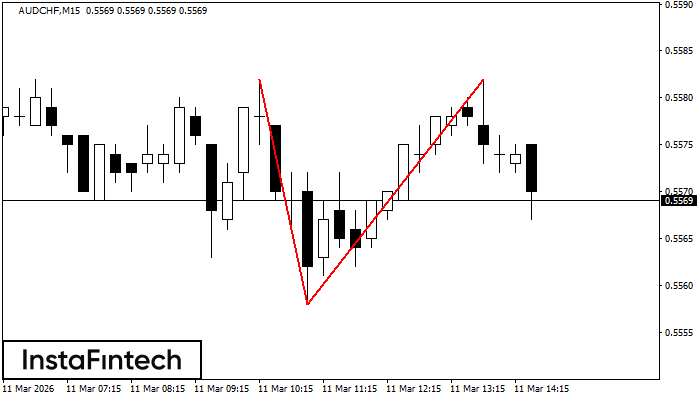
The Double Top pattern has been formed on AUDCHF M15. It signals that the trend has been changed from upwards to downwards. Probably, if the base of the pattern 0.5558 is broken, the downward movement will continue.
AUDCHF M5
Double Top
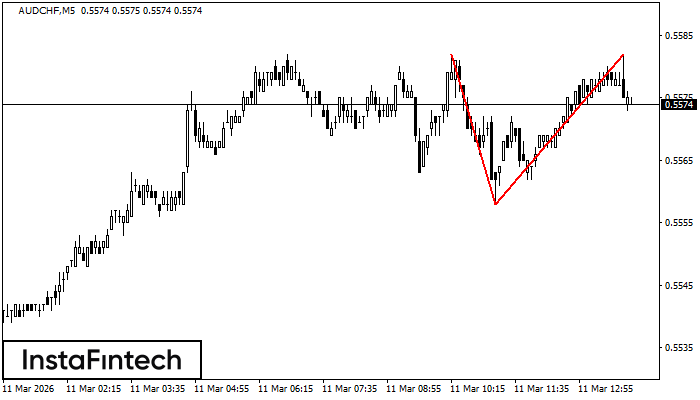
The Double Top reversal pattern has been formed on AUDCHF M5. Characteristics: the upper boundary 0.5582; the lower boundary 0.5558; the width of the pattern is 24 points. Sell trades are better to be opened below the lower boundary 0.5558 with a possible movements towards the 0.5543 level.
AUDCHF M30
Double Top
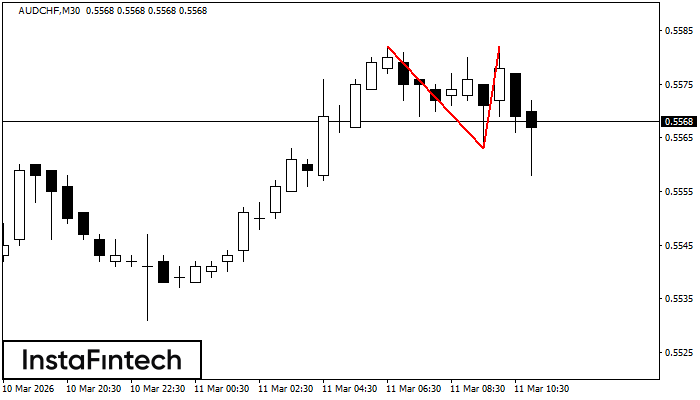
The Double Top reversal pattern has been formed on AUDCHF M30. Characteristics: the upper boundary 0.5582; the lower boundary 0.5563; the width of the pattern is 19 points. Sell trades are better to be opened below the lower boundary 0.5563 with a possible movements towards the 0.5533 level.
AUDCHF M15
Double Top
The Double Top reversal pattern has been formed on AUDCHF M15. Characteristics: the upper boundary 0.5580; the lower boundary 0.5563; the width of the pattern is 19 points. Sell trades are better to be opened below the lower boundary 0.5563 with a possible movements towards the 0.5541 level.
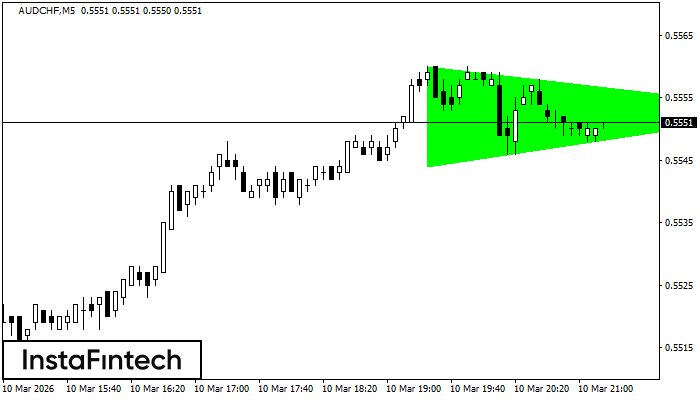
AUDCHF M5
Bullish Symmetrical Triangle
According to the chart of M5, AUDCHF formed the Bullish Symmetrical Triangle pattern. The lower border of the pattern touches the coordinates 0.5544/0.5553 whereas the upper border goes across 0.5560/0.5553. If the Bullish Symmetrical Triangle pattern is in progress, this evidently signals a further upward trend. In other words, in case the scenario comes true, the price of AUDCHF will breach the upper border to head for 0.5568.

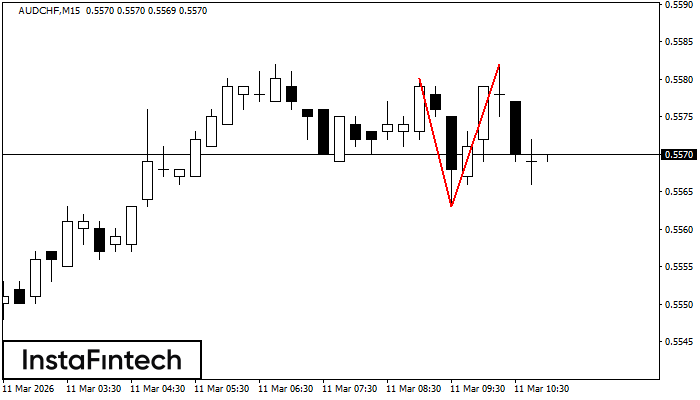
AUDCHF M15
Triple Top
The Triple Top pattern has formed on the chart of the AUDCHF M15. Features of the pattern: borders have an ascending angle; the lower line of the pattern has the coordinates 0.5507/0.5515 with the upper limit 0.5524/0.5527; the projection of the width is 17 points. The formation of the Triple Top figure most likely indicates a change in the trend from upward to downward. This means that in the event of a breakdown of the support level of 0.5507, the price is most likely to continue the downward movement.
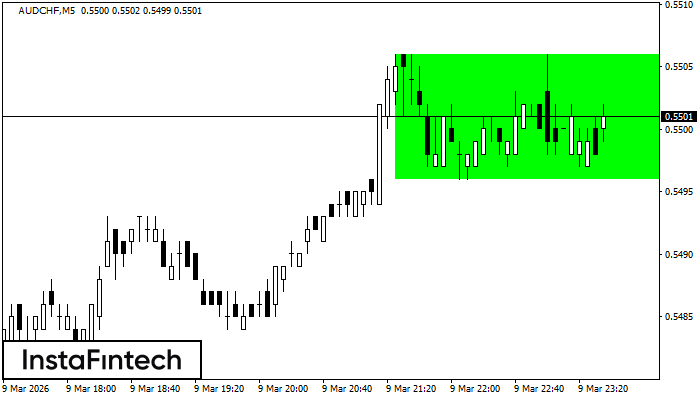
AUDCHF M5
Bullish Rectangle
According to the chart of M5, AUDCHF formed the Bullish Rectangle. This type of a pattern indicates a trend continuation. It consists of two levels: resistance 0.5506 and support 0.5496. In case the resistance level 0.5506 - 0.5506 is broken, the instrument is likely to follow the bullish trend.
AUDCHF M5
Double Bottom
The Double Bottom pattern has been formed on AUDCHF M5. This formation signals a reversal of the trend from downwards to upwards. The signal is that a buy trade should be opened after the upper boundary of the pattern 0.5447 is broken. The further movements will rely on the width of the current pattern 9 points.

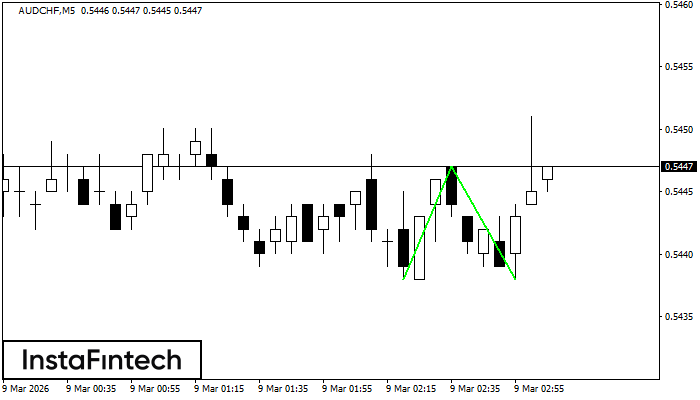
AUDCHF M5
Bearish Flag
The Bearish Flag pattern has been formed on the chart AUDCHF M5. Therefore, the downwards trend is likely to continue in the nearest term. As soon as the price breaks below the low at 0.5438, traders should enter the market.