 Français
  Русский
 English
 Bahasa Indonesia
 Bahasa Malay
 ไทย
ไทย Español
 Deutsch
 Български
 Tiếng Việt
 中文
中文 বাংলা
বাংলা हिन्दी
 Čeština
 Українська
 Română
FX.co ★ Patterns #AMZN | Cours des actions d'Amazon.com, Inc.

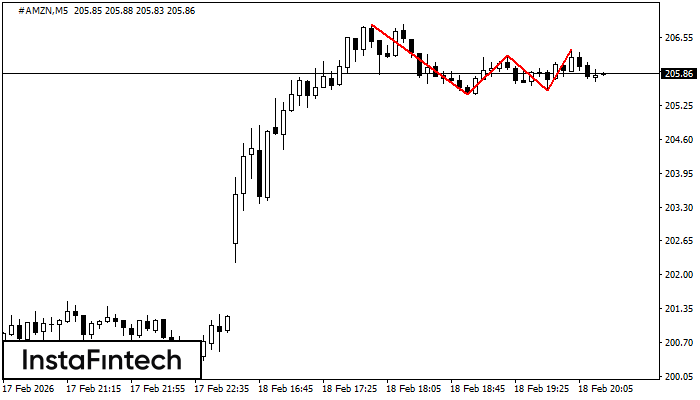
#AMZN M5
Triple Top
On the chart of the #AMZN M5 trading instrument, the Triple Top pattern that signals a trend change has formed. It is possible that after formation of the third peak, the price will try to break through the resistance level 205.46, where we advise to open a trading position for sale. Take profit is the projection of the pattern’s width, which is 134 points.
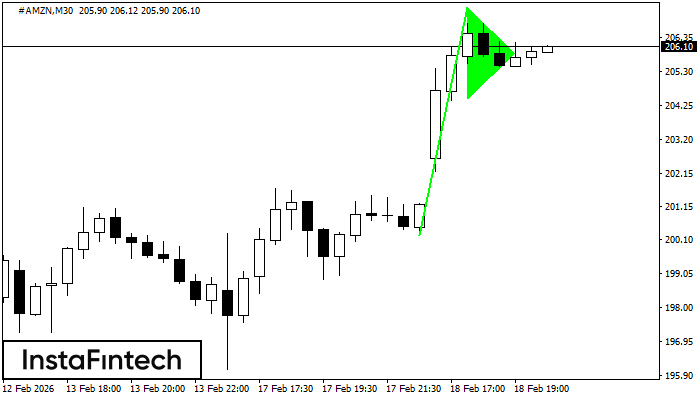
#AMZN M30
Bullish pennant
The Bullish pennant signal – Trading instrument #AMZN M30, continuation pattern. Forecast: it is possible to set up a buy position above the pattern’s high of 207.29, with the prospect of the next move being a projection of the flagpole height.
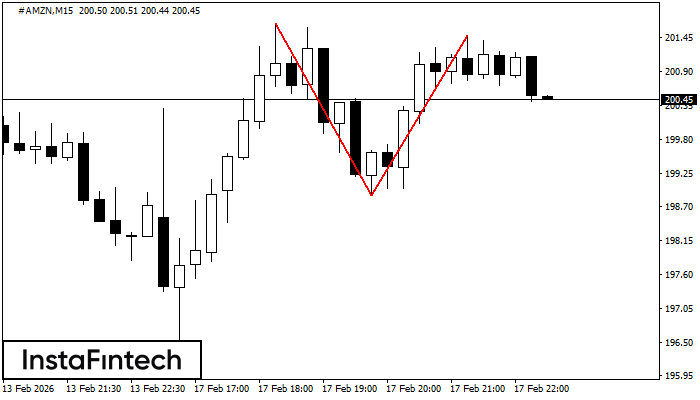
#AMZN M15
Double Top
On the chart of #AMZN M15 the Double Top reversal pattern has been formed. Characteristics: the upper boundary 201.48; the lower boundary 198.88; the width of the pattern 260 points. The signal: a break of the lower boundary will cause continuation of the downward trend targeting the 198.65 level.
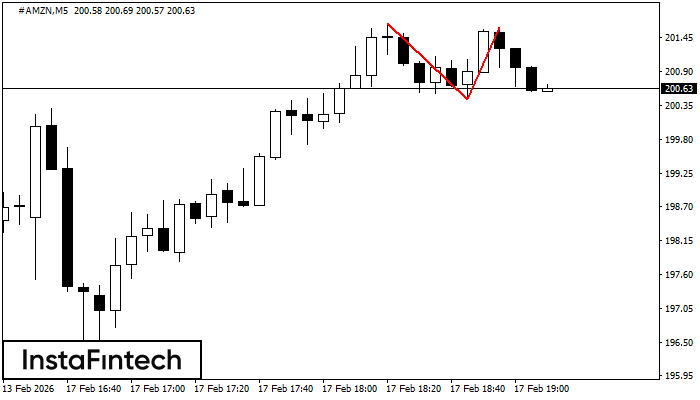
#AMZN M5
Double Top
The Double Top reversal pattern has been formed on #AMZN M5. Characteristics: the upper boundary 201.68; the lower boundary 200.44; the width of the pattern is 118 points. Sell trades are better to be opened below the lower boundary 200.44 with a possible movements towards the 200.29 level.
#AMZN H1
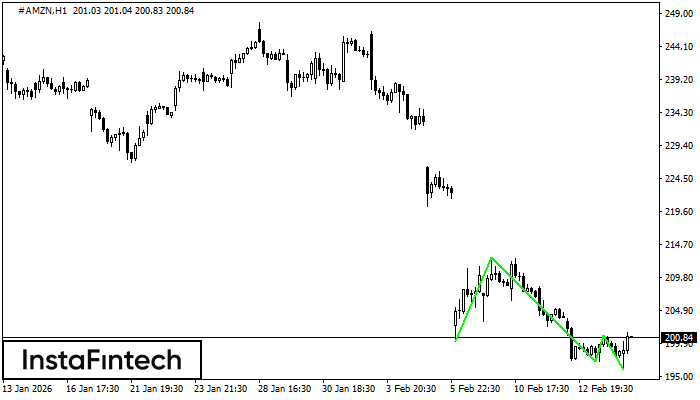
Triple Bottom
The Triple Bottom pattern has formed on the chart of the #AMZN H1 trading instrument. The pattern signals a change in the trend from downwards to upwards in the case of breakdown of 212.75/201.11.
#AMZN M5
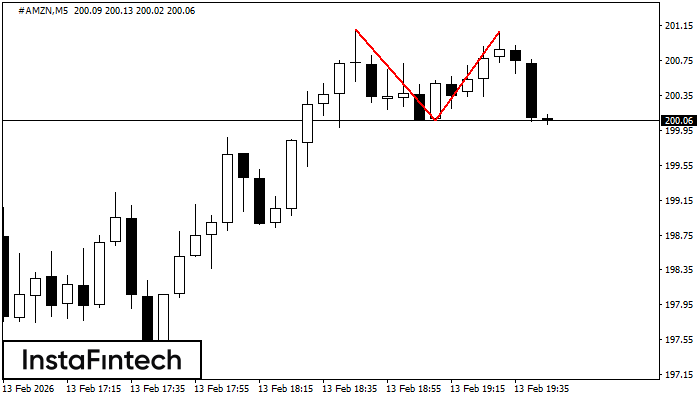
Double Top
On the chart of #AMZN M5 the Double Top reversal pattern has been formed. Characteristics: the upper boundary 201.08; the lower boundary 200.06; the width of the pattern 102 points. The signal: a break of the lower boundary will cause continuation of the downward trend targeting the 199.91 level.

#AMZN M30
Bearish pennant
The Bearish pennant pattern has formed on the #AMZN M30 chart. This pattern type is characterized by a slight slowdown after which the price will move in the direction of the original trend. In case the price fixes below the pattern’s low of 197.05, a trader will be able to successfully enter the sell position.
#AMZN M5
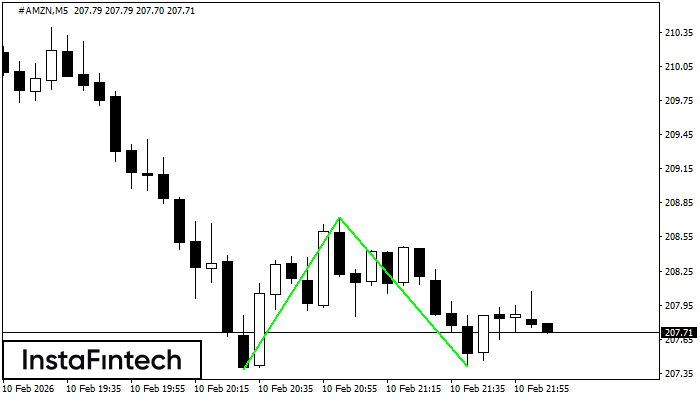
Double Bottom
The Double Bottom pattern has been formed on #AMZN M5; the upper boundary is 208.72; the lower boundary is 207.41. The width of the pattern is 134 points. In case of a break of the upper boundary 208.72, a change in the trend can be predicted where the width of the pattern will coincide with the distance to a possible take profit level.
#AMZN M5
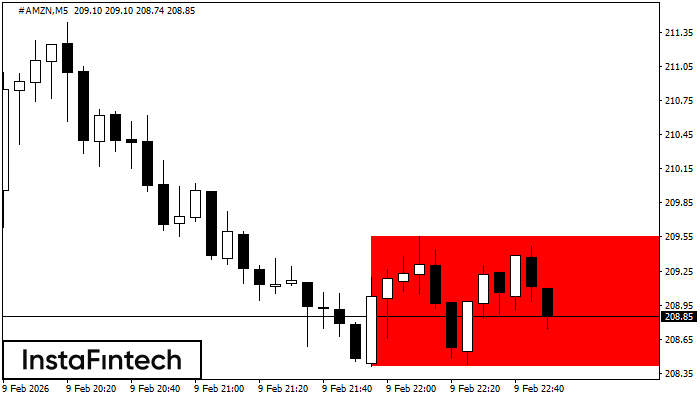
Bearish Rectangle
According to the chart of M5, #AMZN formed the Bearish Rectangle which is a pattern of a trend continuation. The pattern is contained within the following borders: lower border 208.41 – 208.41 and upper border 209.55 – 209.55. In case the lower border is broken, the instrument is likely to follow the downward trend.
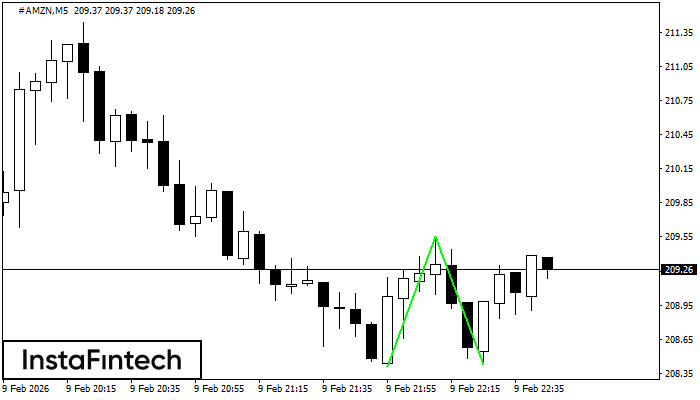
#AMZN M5
Double Bottom
The Double Bottom pattern has been formed on #AMZN M5; the upper boundary is 209.55; the lower boundary is 208.43. The width of the pattern is 114 points. In case of a break of the upper boundary 209.55, a change in the trend can be predicted where the width of the pattern will coincide with the distance to a possible take profit level.