 English
  Русский
 Bahasa Indonesia
 Bahasa Malay
 ไทย
ไทย Español
 Deutsch
 Български
 Français
 Tiếng Việt
 中文
中文 বাংলা
বাংলা हिन्दी
 Čeština
 Українська
 Română
FX.co ★ Patterns #TSLA | Tesla, Inc. Stock Price

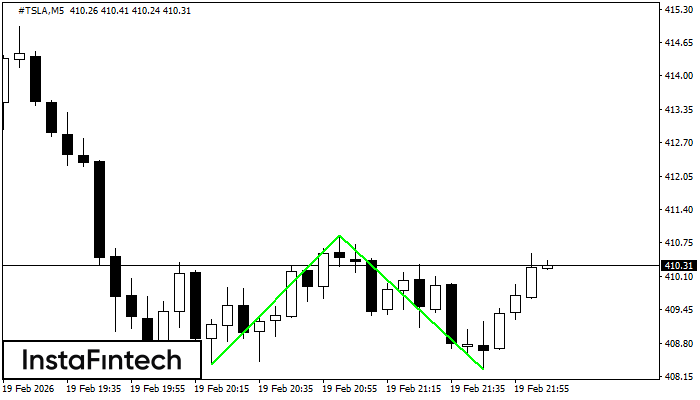
#TSLA M5
Double Bottom
The Double Bottom pattern has been formed on #TSLA M5. Characteristics: the support level 408.39; the resistance level 410.90; the width of the pattern 251 points. If the resistance level is broken, a change in the trend can be predicted with the first target point lying at the distance of 261 points.
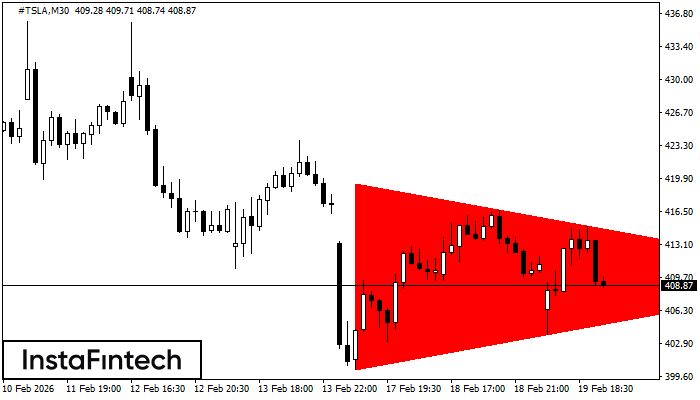
#TSLA M30
Bearish Symmetrical Triangle
According to the chart of M30, #TSLA formed the Bearish Symmetrical Triangle pattern. Trading recommendations: A breach of the lower border 400.29 is likely to encourage a continuation of the downward trend.
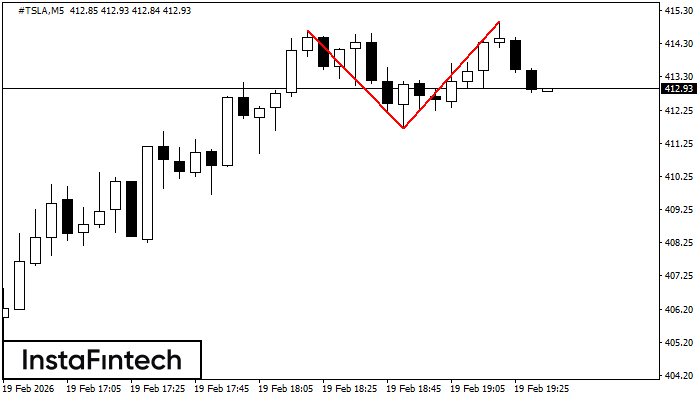
#TSLA M5
Double Top
The Double Top pattern has been formed on #TSLA M5. It signals that the trend has been changed from upwards to downwards. Probably, if the base of the pattern 411.71 is broken, the downward movement will continue.
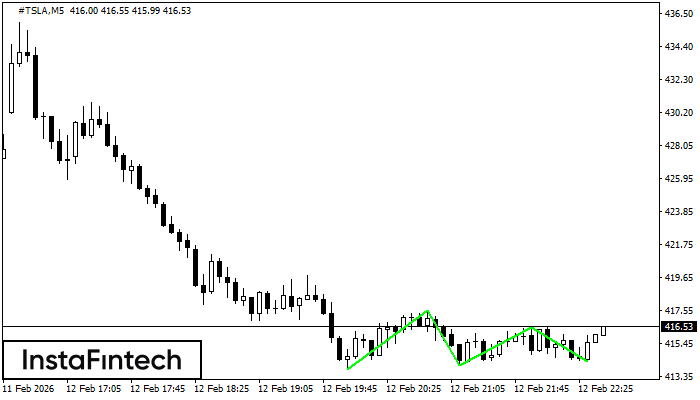
#TSLA M5
Triple Bottom
The Triple Bottom pattern has formed on the chart of the #TSLA M5 trading instrument. The pattern signals a change in the trend from downwards to upwards in the case of breakdown of 417.59/416.51.
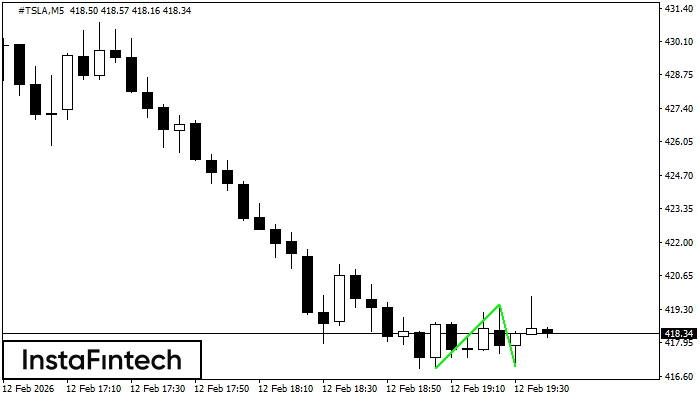
#TSLA M5
Double Bottom
The Double Bottom pattern has been formed on #TSLA M5; the upper boundary is 419.51; the lower boundary is 417.02. The width of the pattern is 260 points. In case of a break of the upper boundary 419.51, a change in the trend can be predicted where the width of the pattern will coincide with the distance to a possible take profit level.
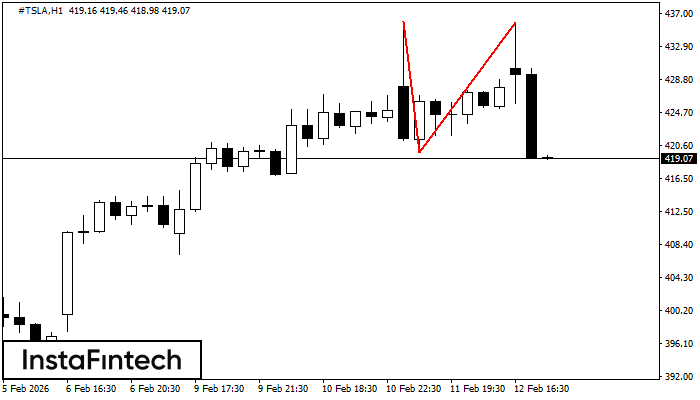
#TSLA H1
Double Top
The Double Top reversal pattern has been formed on #TSLA H1. Characteristics: the upper boundary 435.99; the lower boundary 419.81; the width of the pattern is 1611 points. Sell trades are better to be opened below the lower boundary 419.81 with a possible movements towards the 419.41 level.
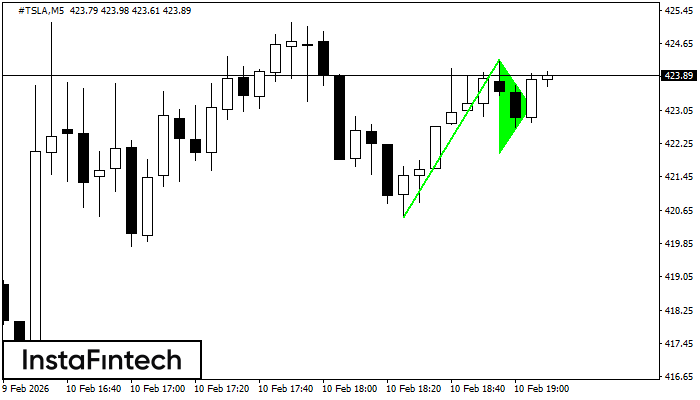
#TSLA M5
Bullish pennant
The Bullish pennant graphic pattern has formed on the #TSLA M5 instrument. This pattern type falls under the category of continuation patterns. In this case, if the quote can breaks out high, is expected to continue the upward trend to level 424.43.
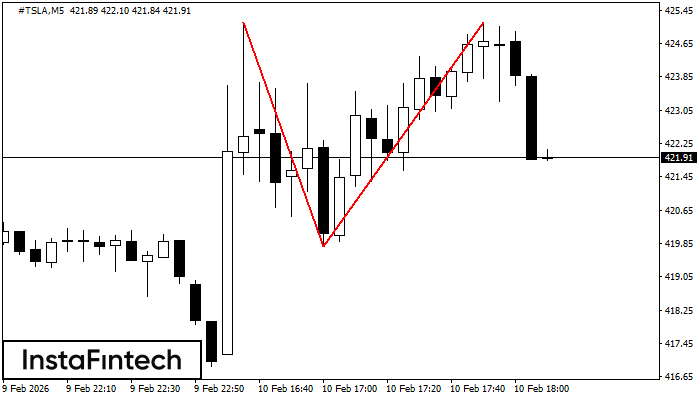
#TSLA M5
Double Top
The Double Top reversal pattern has been formed on #TSLA M5. Characteristics: the upper boundary 425.16; the lower boundary 419.78; the width of the pattern is 537 points. Sell trades are better to be opened below the lower boundary 419.78 with a possible movements towards the 419.63 level.
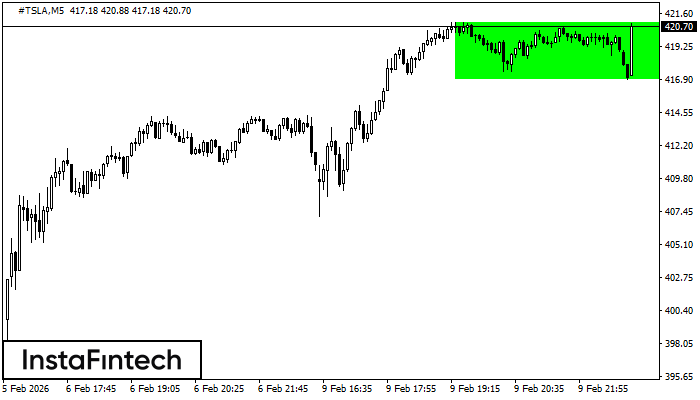
#TSLA M5
Bullish Rectangle
According to the chart of M5, #TSLA formed the Bullish Rectangle. This type of a pattern indicates a trend continuation. It consists of two levels: resistance 420.98 and support 416.89. In case the resistance level 420.98 - 420.98 is broken, the instrument is likely to follow the bullish trend.
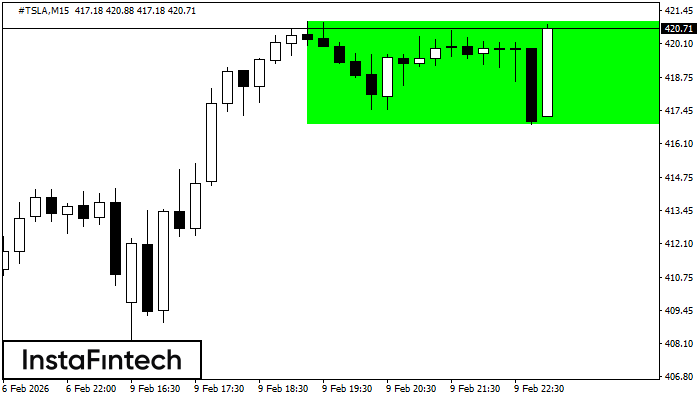
#TSLA M15
Bullish Rectangle
According to the chart of M15, #TSLA formed the Bullish Rectangle which is a pattern of a trend continuation. The pattern is contained within the following borders: the lower border 416.89 – 416.89 and upper border 420.98 – 420.98. In case the upper border is broken, the instrument is likely to follow the upward trend.