 English
  Русский
 Bahasa Indonesia
 Bahasa Malay
 ไทย
ไทย Español
 Deutsch
 Български
 Français
 Tiếng Việt
 中文
中文 বাংলা
বাংলা हिन्दी
 Čeština
 Українська
 Română
FX.co ★ Patterns SILVER | Silver Rate in the Forex market

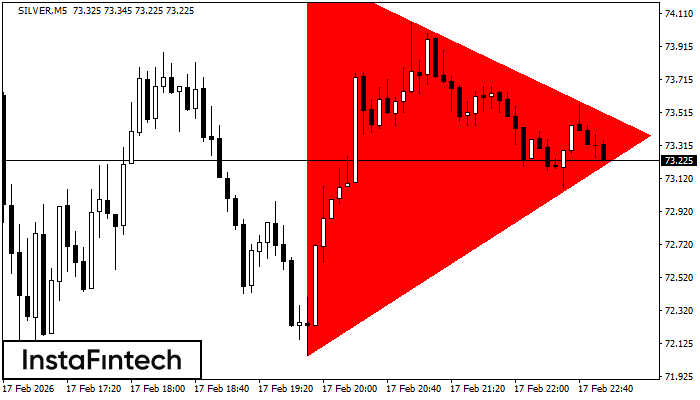
SILVER M5
Bearish Symmetrical Triangle
According to the chart of M5, SILVER formed the Bearish Symmetrical Triangle pattern. Trading recommendations: A breach of the lower border 72.05 is likely to encourage a continuation of the downward trend.
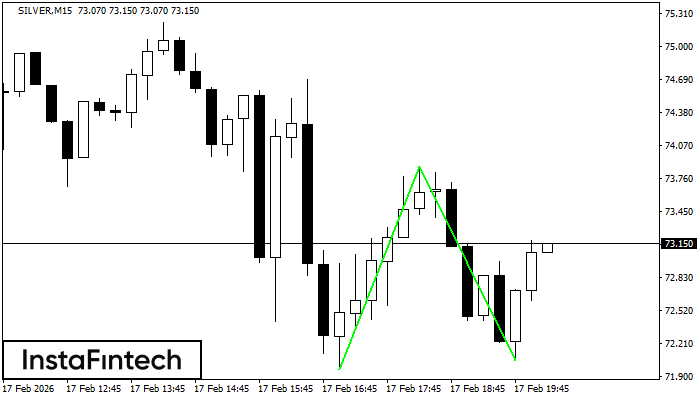
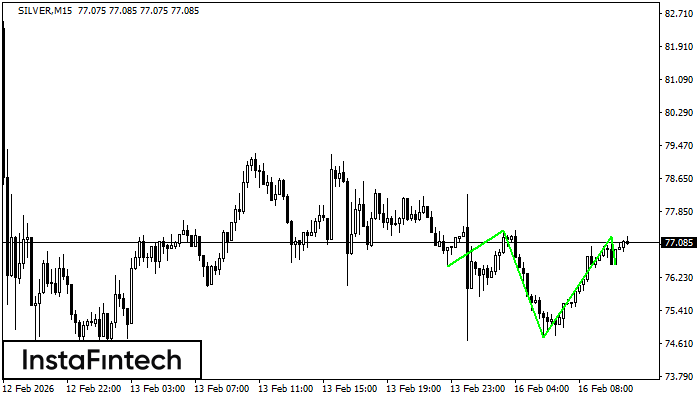
SILVER M15
Double Bottom
The Double Bottom pattern has been formed on SILVER M15. This formation signals a reversal of the trend from downwards to upwards. The signal is that a buy trade should be opened after the upper boundary of the pattern 73.88 is broken. The further movements will rely on the width of the current pattern 1905 points.
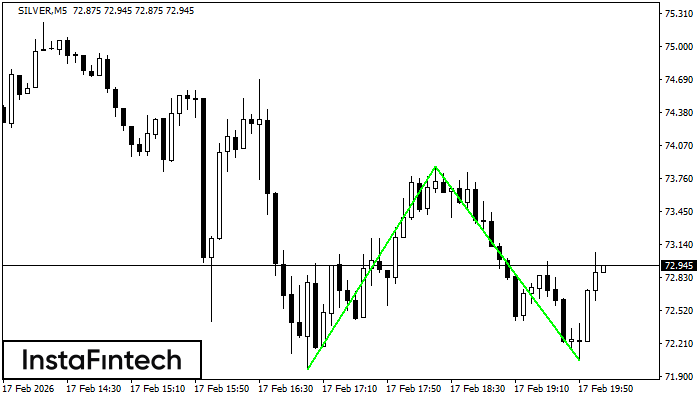
SILVER M5
Double Bottom
The Double Bottom pattern has been formed on SILVER M5; the upper boundary is 73.88; the lower boundary is 72.05. The width of the pattern is 1905 points. In case of a break of the upper boundary 73.88, a change in the trend can be predicted where the width of the pattern will coincide with the distance to a possible take profit level.
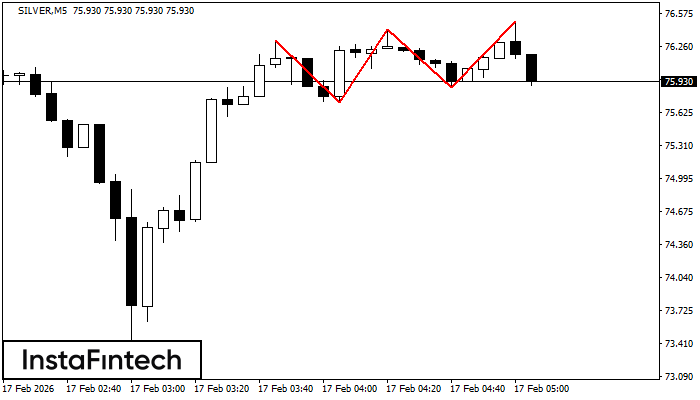
SILVER M5
Triple Top
On the chart of the SILVER M5 trading instrument, the Triple Top pattern that signals a trend change has formed. It is possible that after formation of the third peak, the price will try to break through the resistance level 75.72, where we advise to open a trading position for sale. Take profit is the projection of the pattern’s width, which is 590 points.
SILVER M5
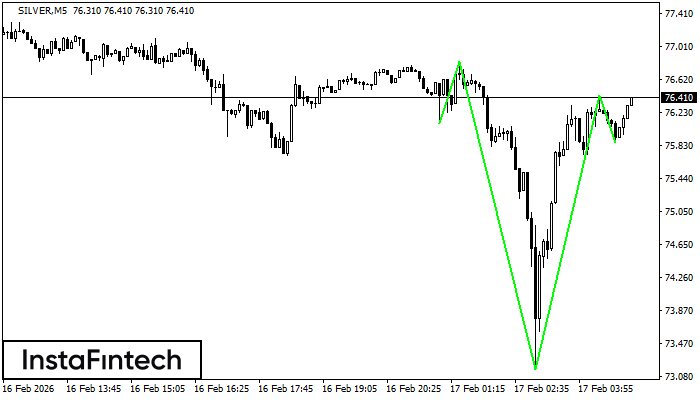
Inverse Head and Shoulder
According to M5, SILVER is shaping the technical pattern – the Inverse Head and Shoulder. In case the Neckline 76.83/76.42 is broken out, the instrument is likely to move toward 76.44.
SILVER M15
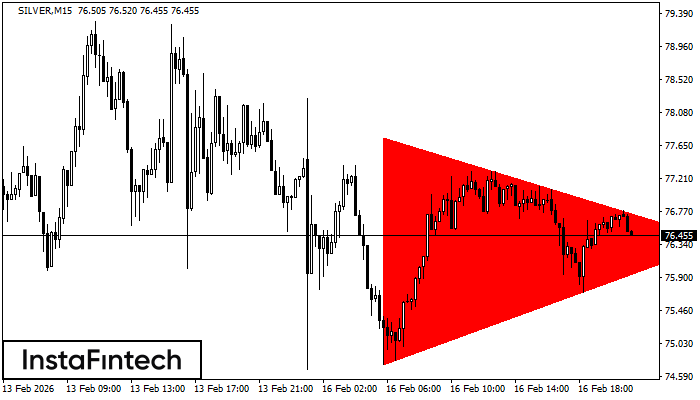
Bearish Symmetrical Triangle
According to the chart of M15, SILVER formed the Bearish Symmetrical Triangle pattern. Trading recommendations: A breach of the lower border 74.75 is likely to encourage a continuation of the downward trend.
SILVER M5
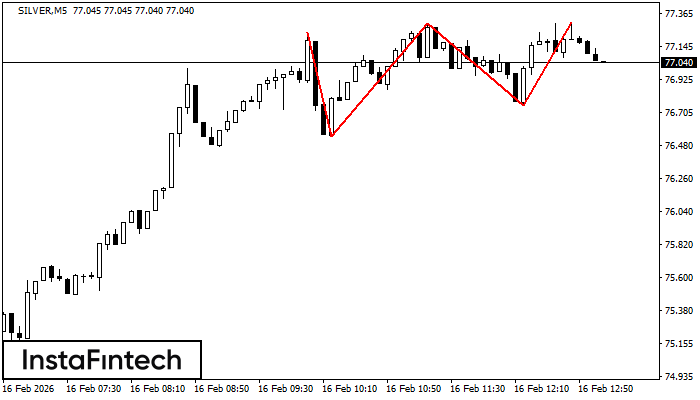
Triple Top
The Triple Top pattern has formed on the chart of the SILVER M5 trading instrument. It is a reversal pattern featuring the following characteristics: resistance level -65, support level -210, and pattern’s width 700. Forecast If the price breaks through the support level 76.54, it is likely to move further down to 77.28.
SILVER M5
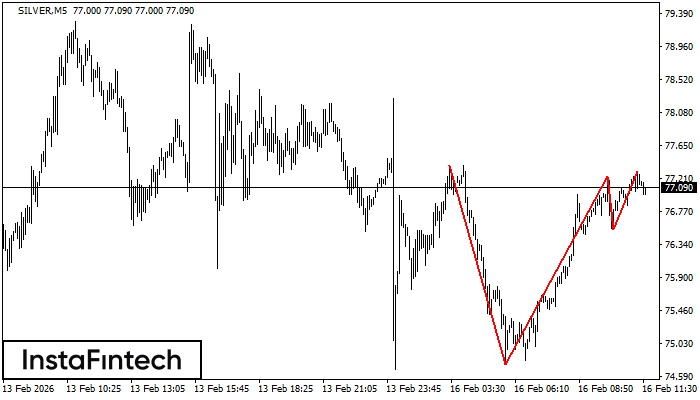
Triple Top
The Triple Top pattern has formed on the chart of the SILVER M5 trading instrument. It is a reversal pattern featuring the following characteristics: resistance level 80, support level -1790, and pattern’s width 2630. Forecast If the price breaks through the support level 74.75, it is likely to move further down to 77.22.
SILVER M15
Inverse Head and Shoulder
According to the chart of M15, SILVER formed the Inverse Head and Shoulder pattern. The Head’s top is set at 77.24 while the median line of the Neck is found at 74.75/76.54. The formation of the Inverse Head and Shoulder pattern evidently signals a reversal of the downward trend. In other words, in case the scenario comes true, the price of SILVER will go towards 77.26
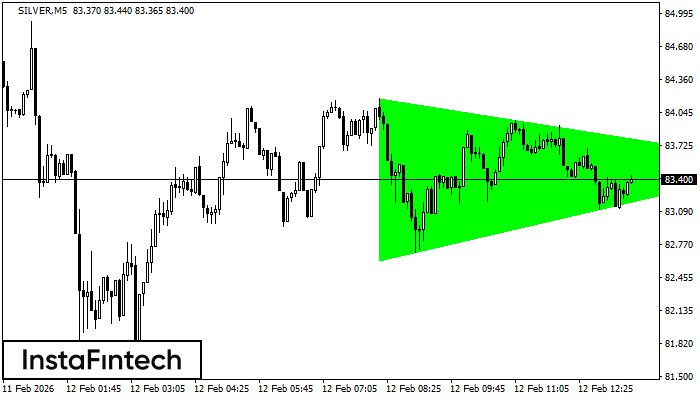
SILVER M5
Bullish Symmetrical Triangle
According to the chart of M5, SILVER formed the Bullish Symmetrical Triangle pattern. Description: This is the pattern of a trend continuation. 84.18 and 82.62 are the coordinates of the upper and lower borders respectively. The pattern width is measured on the chart at 1560 pips. Outlook: If the upper border 84.18 is broken, the price is likely to continue its move by 83.56.