 English
  Русский
 Bahasa Indonesia
 Bahasa Malay
 ไทย
ไทย Español
 Deutsch
 Български
 Français
 Tiếng Việt
 中文
中文 বাংলা
বাংলা हिन्दी
 Čeština
 Українська
 Română
FX.co ★ Analytics polkadot

Crypto Analysis
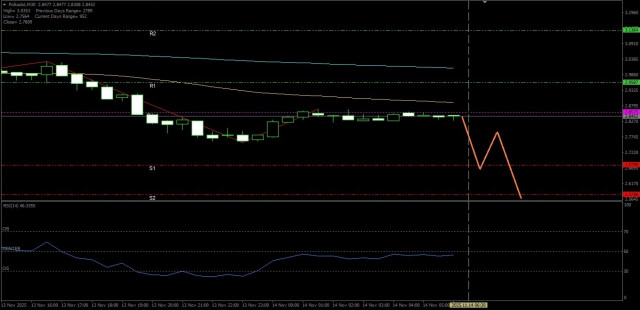
With all of Polkadot's technical conditions showing weakness today, there's potential for this cryptocurrency to weaken further on Friday, November 14, 2025.
[Polkadot] With the RSI in the Neutral-Bearish zone and both EMAs forming a Death Cross, Polkadot is likely to weaken toward its nearest support level today. Key Levels: 1. Resistance...
 Relevance until2025-11-15
Analytical expert:
2025-11-14
Crypto Analysis
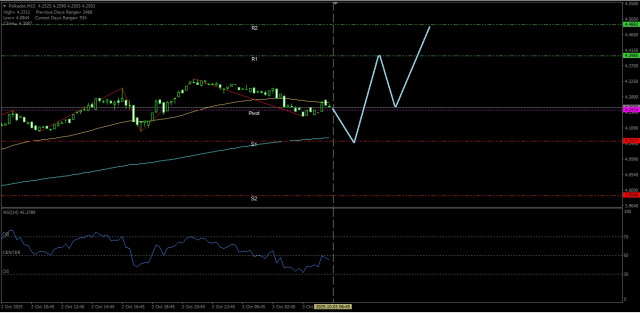
There is an opportunity and potential for Polkadot to strengthen toward its nearest resistance level today. Friday, October 03, 2025.
[Polkadot] – [Friday, October 03, 2025] Although the RSI is at the Neutral-Bearish level, but with EMA(50) positioned above EMA(200), Polkadot has the potential to strengthen today. Key Levels Level-Level...
Relevance until2025-10-04Analytical expert:
2025-10-03
Crypto Analysis
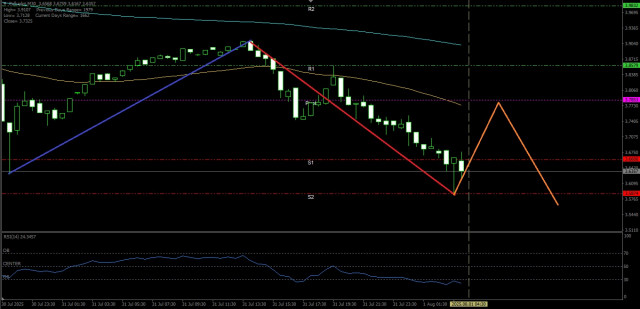
Could Polkadot continue the path to its support level? Friday, August 01, 2025.
Polkadot – Friday, August 01, 2025. Sellers are quite dominant in the Polkadot cryptocurrency, as confirmed by the Death Cross EMA position and the RSI(14) indicator in Extreme Bearish conditions...
Relevance until2025-08-02Analytical expert:
2025-08-01
Crypto Analysis
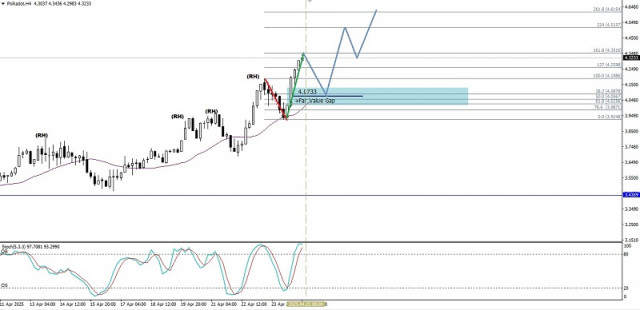
Technical Analysis of Intraday Price Movement of Polkadot Cryptocurrency, Friday April 25, 2025.
With the condition of the Stochastic Oscillator indicator which is already above the Overbought level (80) even though it is currently still moving above the WMA (30 Shift 2) which...
Relevance until2025-04-27Analytical expert:
2025-04-25
Crypto Analysis
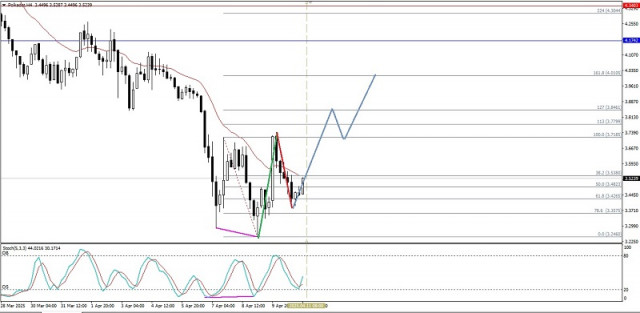
Technical Analysis of Intraday Price Movement of Polkadot Cryptocurrency, Friday April 11, 2025
With the appearance of divergence between the price movement of the Polkadot cryptocurrency and the Stochastic Oscillator indicator on its 4-hour chart, as long as there is no weakening correction...
Relevance until2025-04-13Analytical expert:
2025-04-11
Crypto Analysis
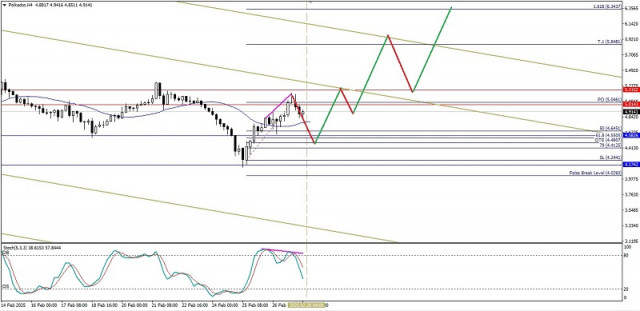
Technical Analysis of Intraday Price Movement of Polkadot Cryptocurrency, Friday February 28, 2025.
If we look at the 4-hour chart of the Polkadot cryptocurrency, it appears that its price movement is moving in a channel that has a decreasing slope and the Stochastic...
Relevance until2025-03-01Analytical expert:
2025-02-28
Crypto Analysis
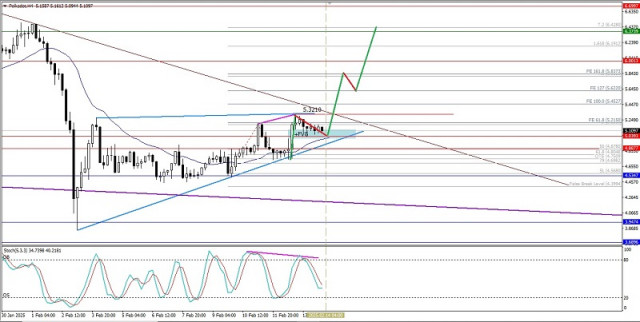
Technical Analysis of Intraday Price Movement of Polkadot Cryptocurrency, Friday February 14, 2025.
With the price movement of Polkadot which is above EMA (21) which also has a slope that is sloping upwards, it provides us with information that currently Buyers are trying...
Relevance until2025-02-16Analytical expert:
2025-02-14
Crypto Analysis
Technical Analysis of Intraday Price Movement of Polkadot Cryptocurrency, Friday January 24, 2025.
From what is seen on the 4-hour chart of the Polkadot cryptocurrency, it appears that the price movement is showing a Bearish 123 pattern followed by the Bearish Ross Hook...
Relevance until2025-01-25Analytical expert:
2025-01-24
Crypto Analysis
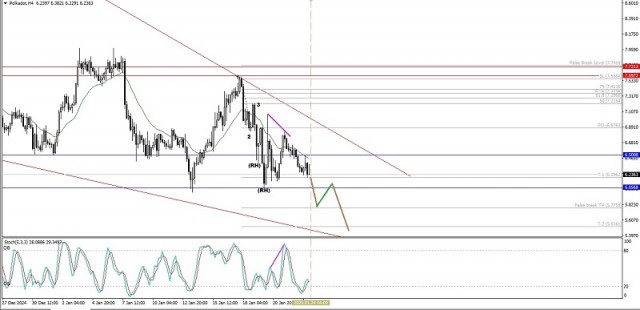
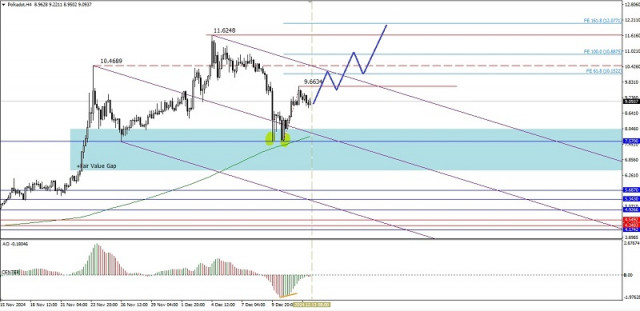
Technical Analysis of Intraday Price Movement of Polkadot Cryptocurrency, Friday December 13, 2024.
Although Polkadot's price movement is moving within the Bearish Pitchfork channel on its 4-hour chart, since its weakening it has been stuck at the support level of 7.5700 which...
Relevance until2024-12-14Analytical expert:
2024-12-13
Crypto Analysis
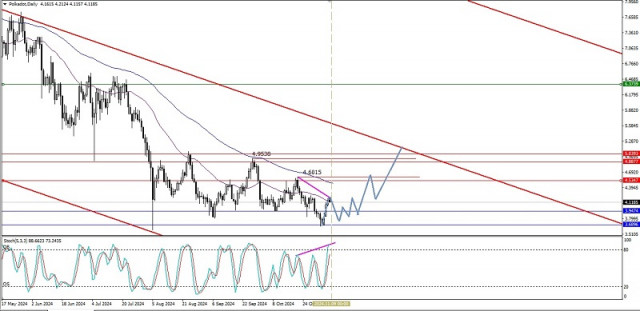
Technical Analysis of Daily Price Movement of Polkadot Cryptocurrency, Friday November 08, 2024
If we look at the daily chart of the Polkadot cryptocurrency, it appears to be under pressure from sellers, as seen from its dynamic price movements within the Bearish Pitchfork...
Relevance until2024-11-22Analytical expert:
2024-11-08