 English
  Русский
 Bahasa Indonesia
 Bahasa Malay
 ไทย
ไทย Español
 Deutsch
 Български
 Français
 Tiếng Việt
 中文
中文 বাংলা
বাংলা हिन्दी
 Čeština
 Українська
 Română
FX.co ★ Patterns #PEP | PepsiCo, Inc. Stock Price

#PEP M5
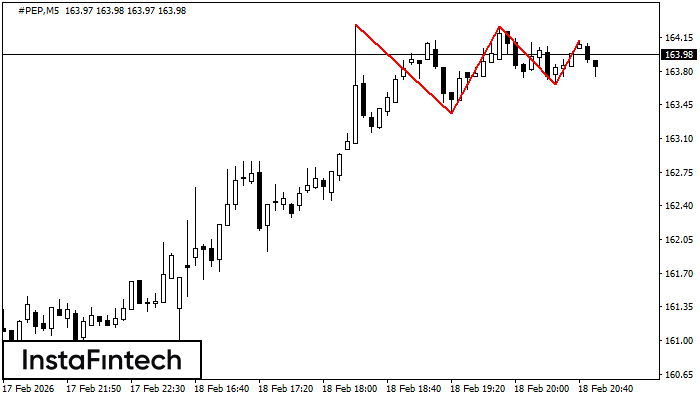
Triple Top
On the chart of the #PEP M5 trading instrument, the Triple Top pattern that signals a trend change has formed. It is possible that after formation of the third peak, the price will try to break through the resistance level 163.36, where we advise to open a trading position for sale. Take profit is the projection of the pattern’s width, which is 93 points.
#PEP M5
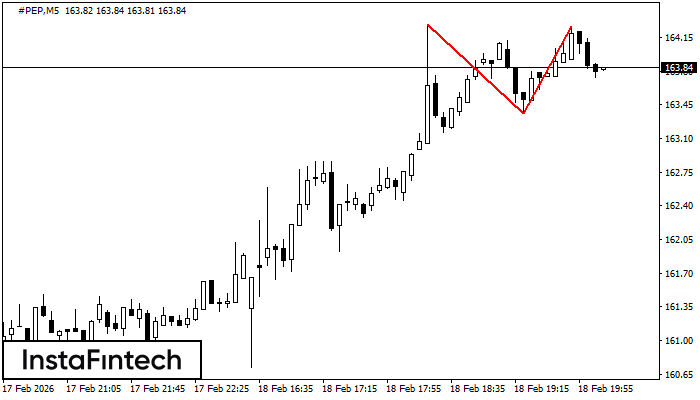
Double Top
On the chart of #PEP M5 the Double Top reversal pattern has been formed. Characteristics: the upper boundary 164.27; the lower boundary 163.36; the width of the pattern 91 points. The signal: a break of the lower boundary will cause continuation of the downward trend targeting the 163.21 level.
#PEP M5
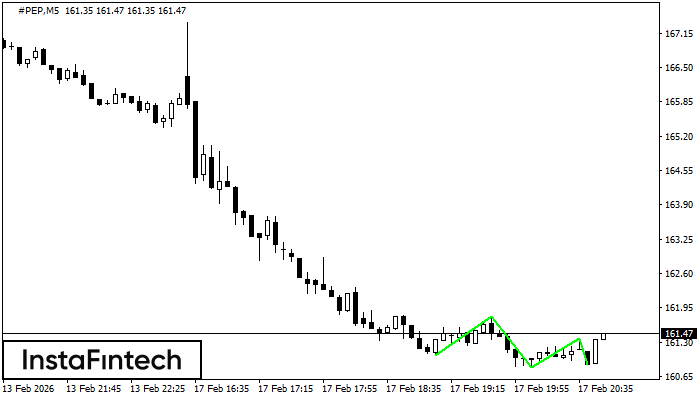
Triple Bottom
The Triple Bottom pattern has formed on the chart of the #PEP M5 trading instrument. The pattern signals a change in the trend from downwards to upwards in the case of breakdown of 161.78/161.37.
#PEP M5
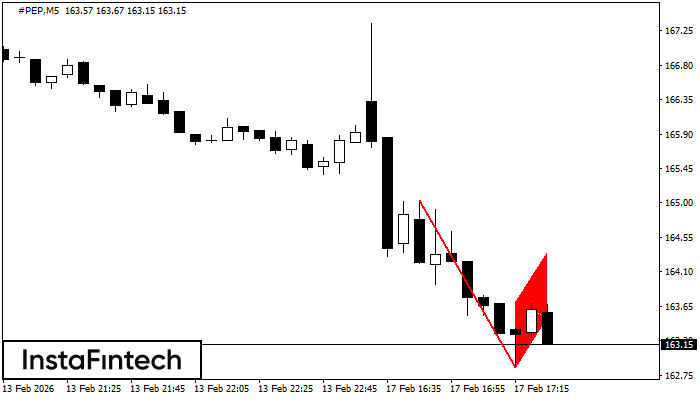
Bearish Flag
The Bearish Flag pattern has been formed on #PEP at M5. The lower boundary of the pattern is located at 162.85/163.51 while the upper boundary lies at 163.71/164.37. The projection of the flagpole is 218 points. This formation signals that the downward trend is most likely to continue. Therefore, if the level of 162.85 is broken, the price will move further downwards.
#PEP M5
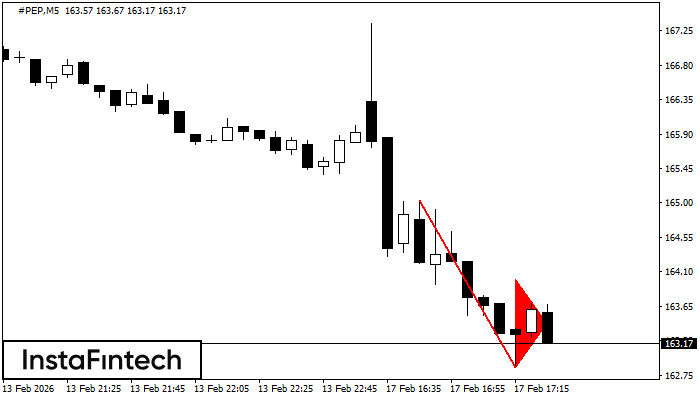
Bearish pennant
The Bearish pennant pattern has formed on the #PEP M5 chart. This pattern type is characterized by a slight slowdown after which the price will move in the direction of the original trend. In case the price fixes below the pattern’s low of 162.85, a trader will be able to successfully enter the sell position.
#PEP M5
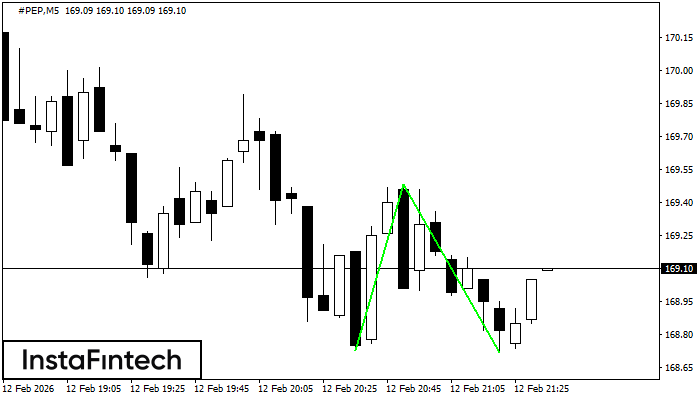
Double Bottom
The Double Bottom pattern has been formed on #PEP M5. Characteristics: the support level 168.73; the resistance level 169.48; the width of the pattern 75 points. If the resistance level is broken, a change in the trend can be predicted with the first target point lying at the distance of 76 points.
#PEP M5
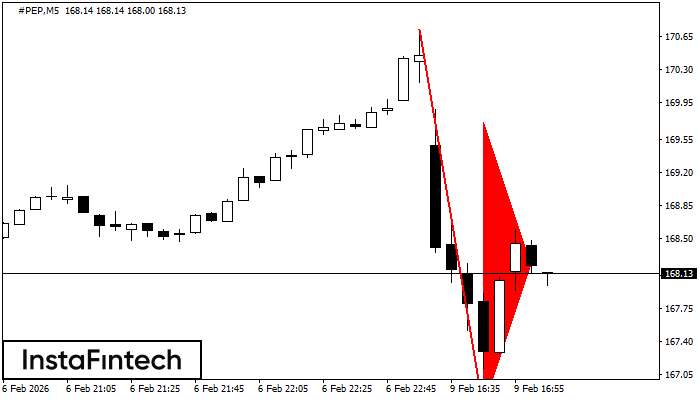
Bearish pennant
The Bearish pennant pattern has formed on the #PEP M5 chart. The pattern signals continuation of the downtrend in case the pennant’s low of 166.69 is broken through. Recommendations: Place the sell stop pending order 10 pips below the pattern’s low. Place the take profit order at the projection distance of the flagpole height.
#PEP M5
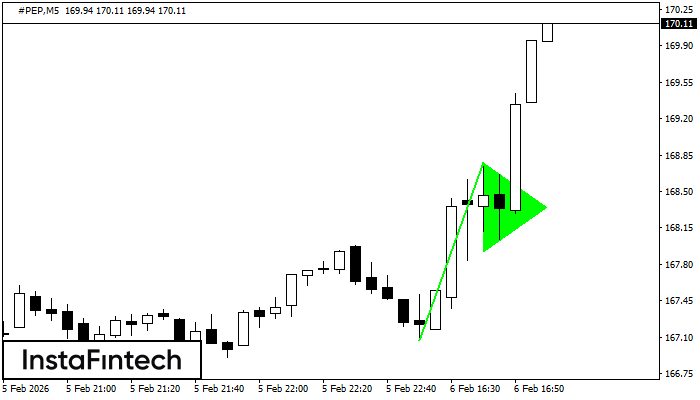
Bullish pennant
The Bullish pennant pattern is formed on the #PEP M5 chart. It is a type of the continuation pattern. Supposedly, in case the price is fixed above the pennant’s high of 168.78, a further uptrend is possible.
#PEP M15
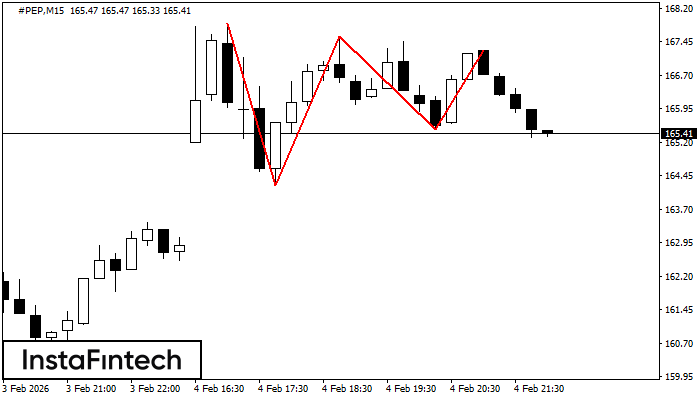
Triple Top
The Triple Top pattern has formed on the chart of the #PEP M15 trading instrument. It is a reversal pattern featuring the following characteristics: resistance level 62, support level -126, and pattern’s width 364. Forecast If the price breaks through the support level 164.23, it is likely to move further down to 167.35.
#PEP M5
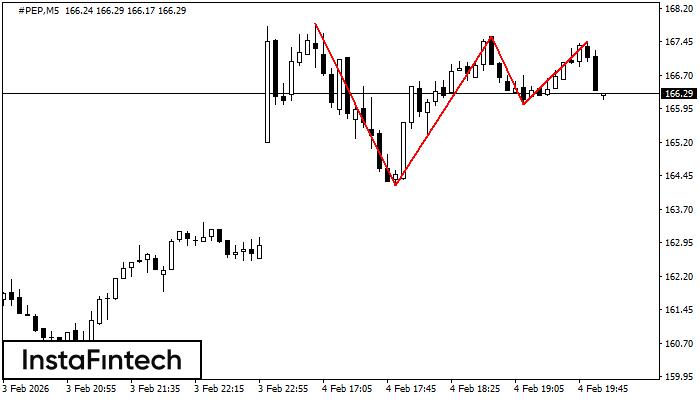
Triple Top
The Triple Top pattern has formed on the chart of the #PEP M5. Features of the pattern: borders have an ascending angle; the lower line of the pattern has the coordinates 164.23/166.04 with the upper limit 167.87/167.45; the projection of the width is 364 points. The formation of the Triple Top figure most likely indicates a change in the trend from upward to downward. This means that in the event of a breakdown of the support level of 164.23, the price is most likely to continue the downward movement.