 English
  Русский
 Bahasa Indonesia
 Bahasa Malay
 ไทย
ไทย Español
 Deutsch
 Български
 Français
 Tiếng Việt
 中文
中文 বাংলা
বাংলা हिन्दी
 Čeština
 Українська
 Română
FX.co ★ Patterns NZDCHF | New Zealand Dollar (NZD) to Swiss Franc (CHF) Rate in the Forex market

NZDCHF M5
Double Top
The Double Top pattern has been formed on NZDCHF M5. It signals that the trend has been changed from upwards to downwards. Probably, if the base of the pattern 0.4613 is broken, the downward movement will continue.
NZDCHF M5
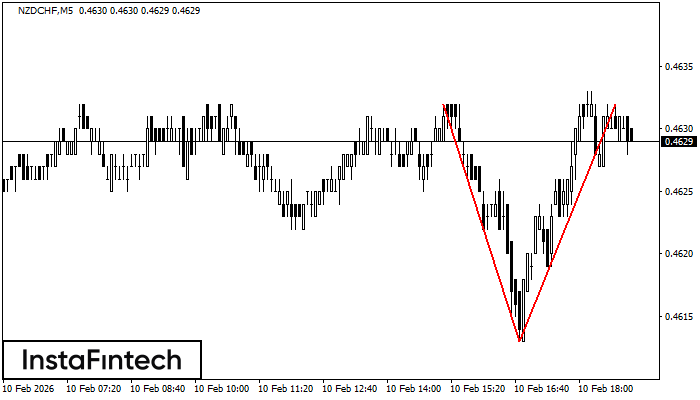
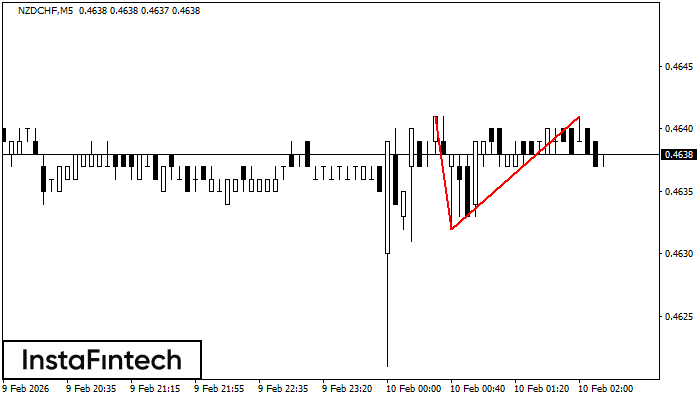
Inverse Head and Shoulder
According to M5, NZDCHF is shaping the technical pattern – the Inverse Head and Shoulder. In case the Neckline 0.4632/0.4631 is broken out, the instrument is likely to move toward 0.4646.
NZDCHF M5
Double Top
On the chart of NZDCHF M5 the Double Top reversal pattern has been formed. Characteristics: the upper boundary 0.4641; the lower boundary 0.4632; the width of the pattern 9 points. The signal: a break of the lower boundary will cause continuation of the downward trend targeting the 0.4617 level.
NZDCHF M15
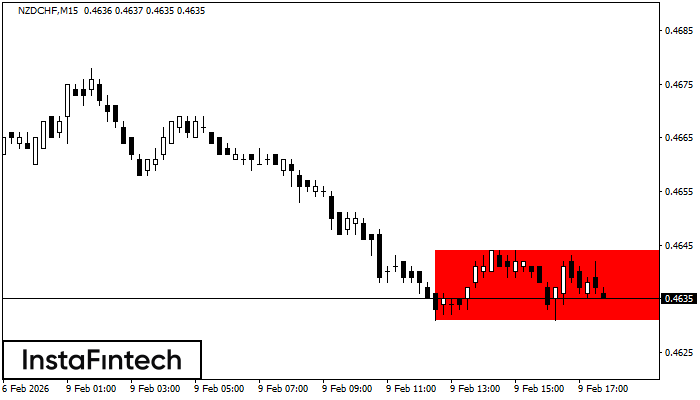
Bearish Rectangle
According to the chart of M15, NZDCHF formed the Bearish Rectangle. The pattern indicates a trend continuation. The upper border is 0.4644, the lower border is 0.4631. The signal means that a short position should be opened after fixing a price below the lower border 0.4631 of the Bearish Rectangle.
NZDCHF M5
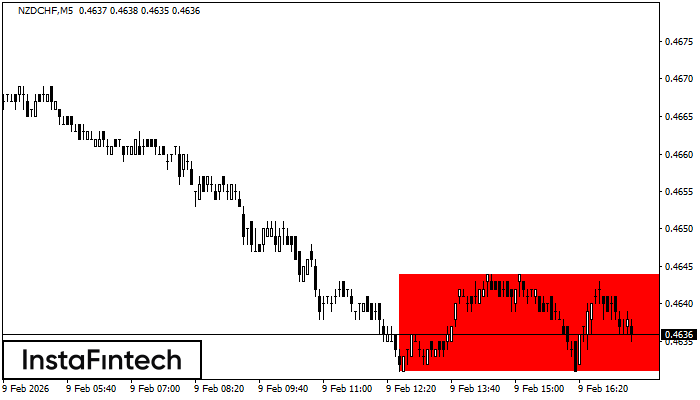
Bearish Rectangle
According to the chart of M5, NZDCHF formed the Bearish Rectangle. This type of a pattern indicates a trend continuation. It consists of two levels: resistance 0.4644 - 0.0000 and support 0.4631 – 0.4631. In case the resistance level 0.4631 - 0.4631 is broken, the instrument is likely to follow the bearish trend.
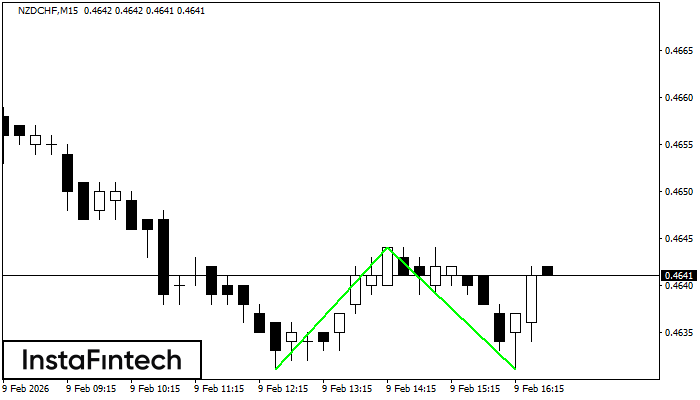
NZDCHF M15
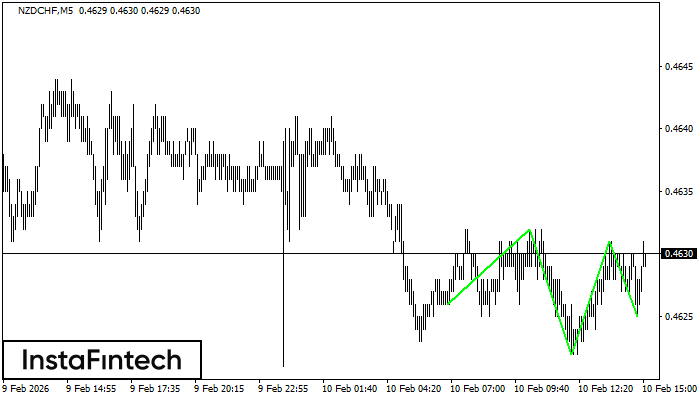
Double Bottom
The Double Bottom pattern has been formed on NZDCHF M15. Characteristics: the support level 0.4631; the resistance level 0.4644; the width of the pattern 13 points. If the resistance level is broken, a change in the trend can be predicted with the first target point lying at the distance of 13 points.
NZDCHF M5
Double Top
On the chart of NZDCHF M5 the Double Top reversal pattern has been formed. Characteristics: the upper boundary 0.4661; the lower boundary 0.4655; the width of the pattern 6 points. The signal: a break of the lower boundary will cause continuation of the downward trend targeting the 0.4640 level.
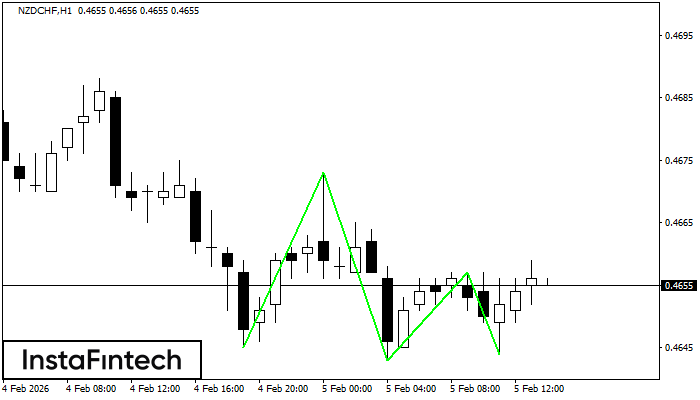
NZDCHF H1
Triple Bottom
The Triple Bottom pattern has formed on the chart of the NZDCHF H1 trading instrument. The pattern signals a change in the trend from downwards to upwards in the case of breakdown of 0.4673/0.4657.
NZDCHF M5
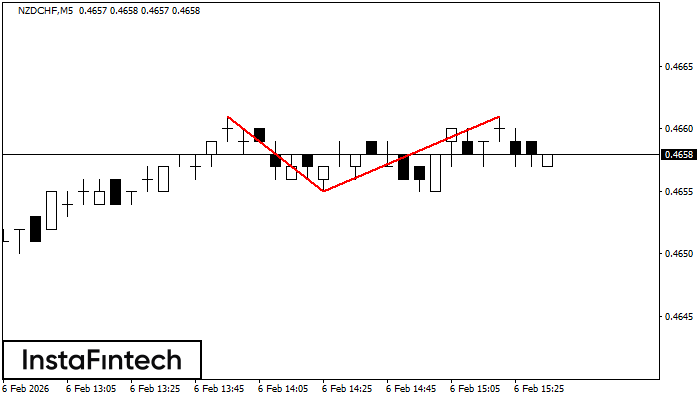
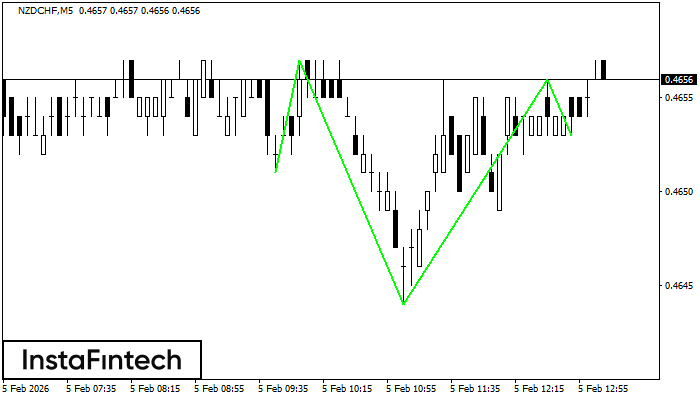
Inverse Head and Shoulder
According to M5, NZDCHF is shaping the technical pattern – the Inverse Head and Shoulder. In case the Neckline 0.4657/0.4656 is broken out, the instrument is likely to move toward 0.4671.
NZDCHF M5
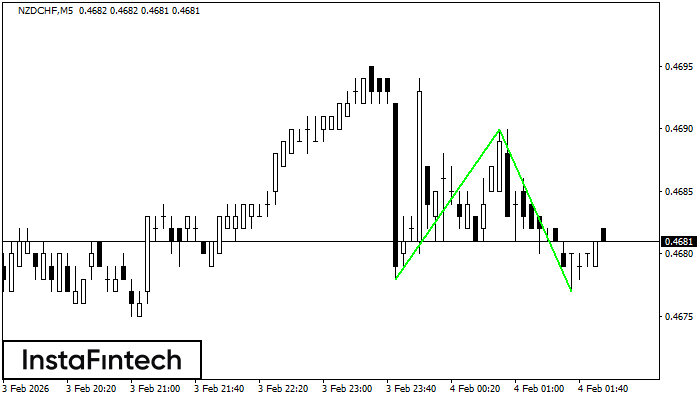
Double Bottom
The Double Bottom pattern has been formed on NZDCHF M5. This formation signals a reversal of the trend from downwards to upwards. The signal is that a buy trade should be opened after the upper boundary of the pattern 0.4690 is broken. The further movements will rely on the width of the current pattern 12 points.