 English
  Русский
 Bahasa Indonesia
 Bahasa Malay
 ไทย
ไทย Español
 Deutsch
 Български
 Français
 Tiếng Việt
 中文
中文 বাংলা
বাংলা हिन्दी
 Čeština
 Українська
 Română
FX.co ★ Patterns #NTDOY | Nintendo Co., Ltd. Stock Price

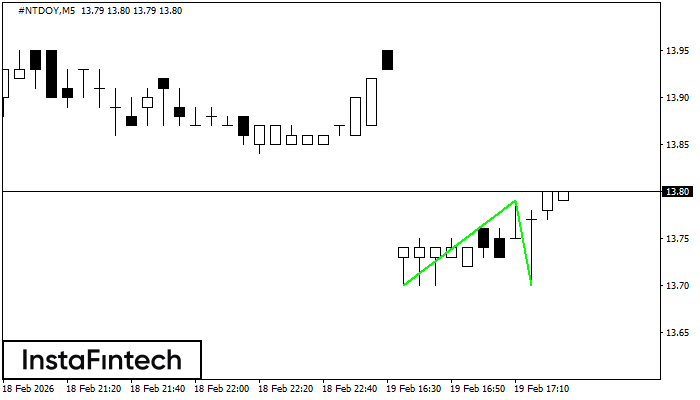
#NTDOY M5
Double Bottom
The Double Bottom pattern has been formed on #NTDOY M5. Characteristics: the support level 13.70; the resistance level 13.79; the width of the pattern 9 points. If the resistance level is broken, a change in the trend can be predicted with the first target point lying at the distance of 9 points.
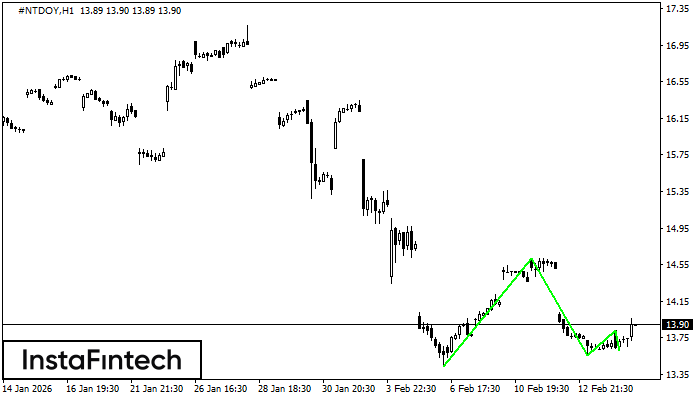
#NTDOY H1
Triple Bottom
The Triple Bottom pattern has formed on the chart of the #NTDOY H1 trading instrument. The pattern signals a change in the trend from downwards to upwards in the case of breakdown of 14.62/13.83.
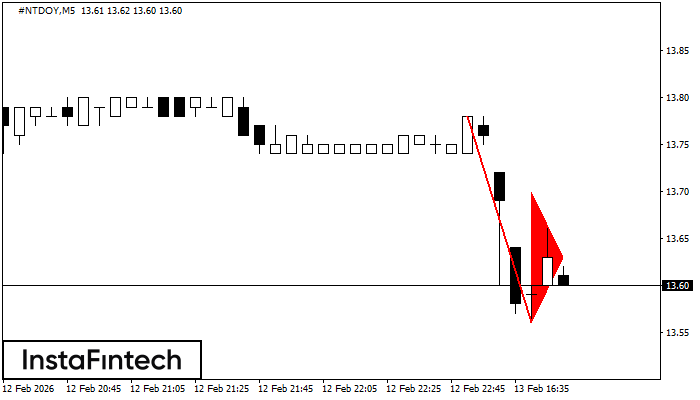
#NTDOY M5
Bearish pennant
The Bearish pennant pattern has formed on the #NTDOY M5 chart. It signals potential continuation of the existing trend. Specifications: the pattern’s bottom has the coordinate of 13.56; the projection of the flagpole height is equal to 22 pips. In case the price breaks out the pattern’s bottom of 13.56, the downtrend is expected to continue for further level 13.41.
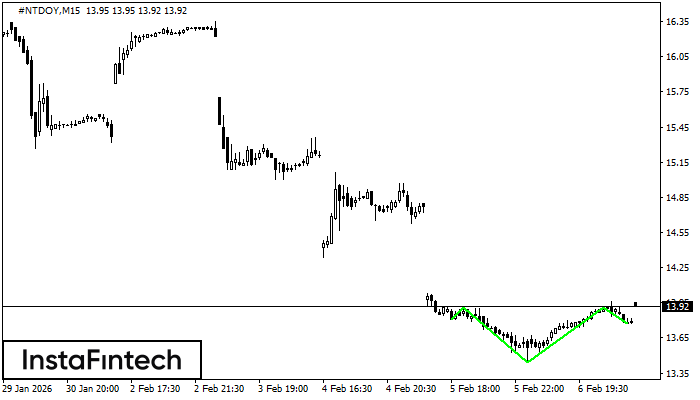
#NTDOY M15
Inverse Head and Shoulder
According to the chart of M15, #NTDOY formed the Inverse Head and Shoulder pattern. The Head’s top is set at 13.91 while the median line of the Neck is found at 13.44/13.77. The formation of the Inverse Head and Shoulder pattern evidently signals a reversal of the downward trend. In other words, in case the scenario comes true, the price of #NTDOY will go towards 14.14
#NTDOY M5
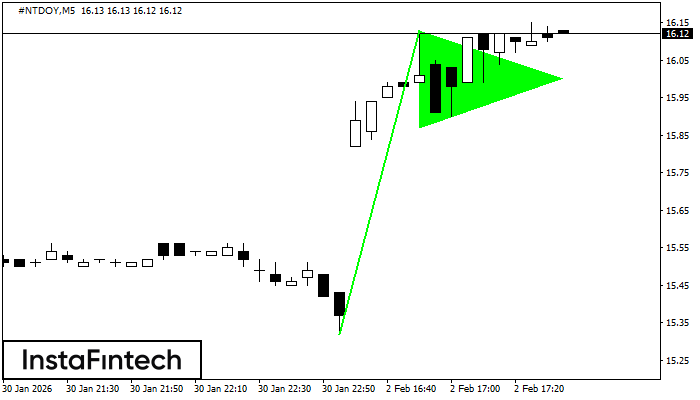
Bullish pennant
The Bullish pennant pattern is formed on the #NTDOY M5 chart. It is a type of the continuation pattern. Supposedly, in case the price is fixed above the pennant’s high of 16.13, a further uptrend is possible.
#NTDOY M15
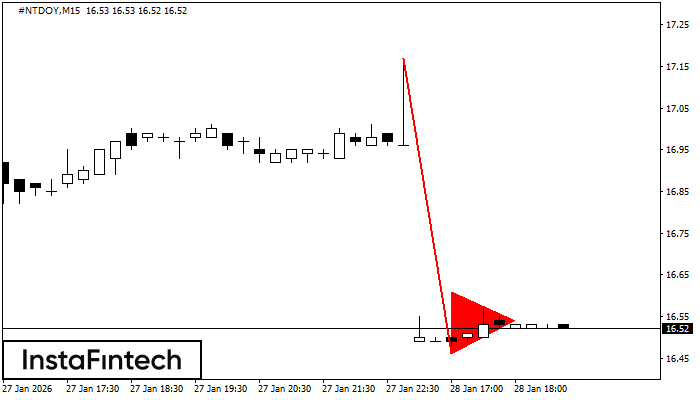
Bearish pennant
The Bearish pennant pattern has formed on the #NTDOY M15 chart. The pattern signals continuation of the downtrend in case the pennant’s low of 16.46 is broken through. Recommendations: Place the sell stop pending order 10 pips below the pattern’s low. Place the take profit order at the projection distance of the flagpole height.
#NTDOY H1
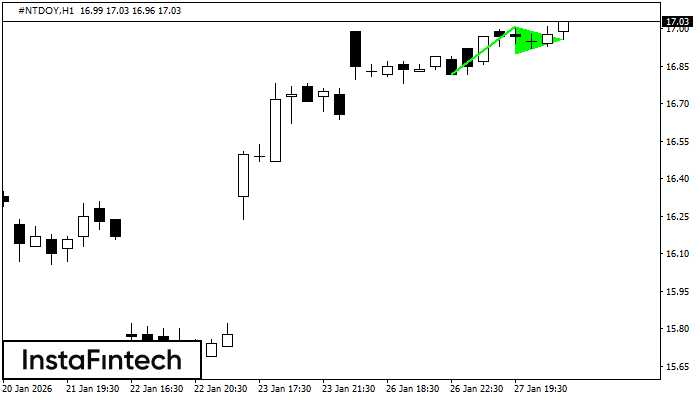
Bullish pennant
The Bullish pennant signal – Trading instrument #NTDOY H1, continuation pattern. Forecast: it is possible to set up a buy position above the pattern’s high of 17.01, with the prospect of the next move being a projection of the flagpole height.
#NTDOY M30
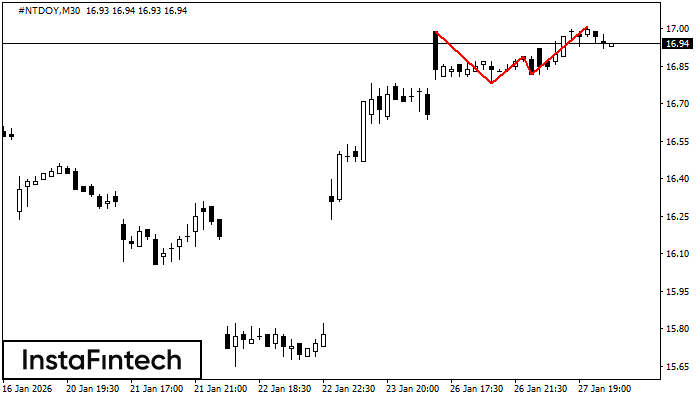
Triple Top
On the chart of the #NTDOY M30 trading instrument, the Triple Top pattern that signals a trend change has formed. It is possible that after formation of the third peak, the price will try to break through the resistance level 16.78, where we advise to open a trading position for sale. Take profit is the projection of the pattern’s width, which is 21 points.
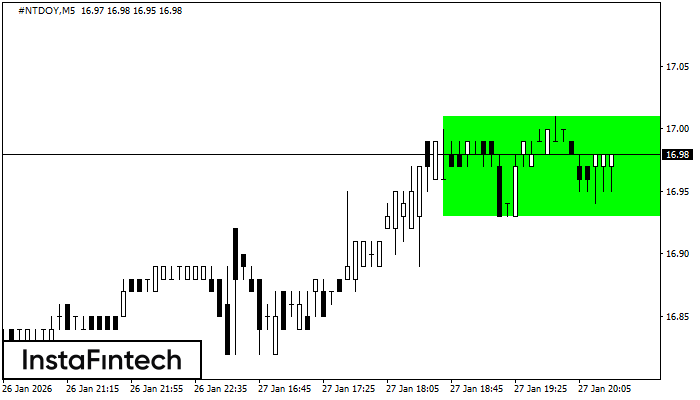
#NTDOY M5
Bullish Rectangle
According to the chart of M5, #NTDOY formed the Bullish Rectangle which is a pattern of a trend continuation. The pattern is contained within the following borders: the lower border 16.93 – 16.93 and upper border 17.01 – 17.01. In case the upper border is broken, the instrument is likely to follow the upward trend.
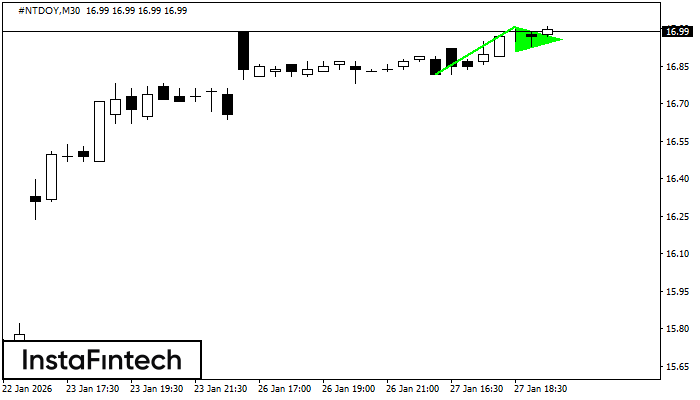
#NTDOY M30
Bullish pennant
The Bullish pennant graphic pattern has formed on the #NTDOY M30 instrument. This pattern type falls under the category of continuation patterns. In this case, if the quote can breaks out high, is expected to continue the upward trend to level 17.31.