 English
  Русский
 Bahasa Indonesia
 Bahasa Malay
 ไทย
ไทย Español
 Deutsch
 Български
 Français
 Tiếng Việt
 中文
中文 বাংলা
বাংলা हिन्दी
 Čeština
 Українська
 Română
FX.co ★ Patterns #KO | The Coca-Cola Company Stock Price

#KO M5
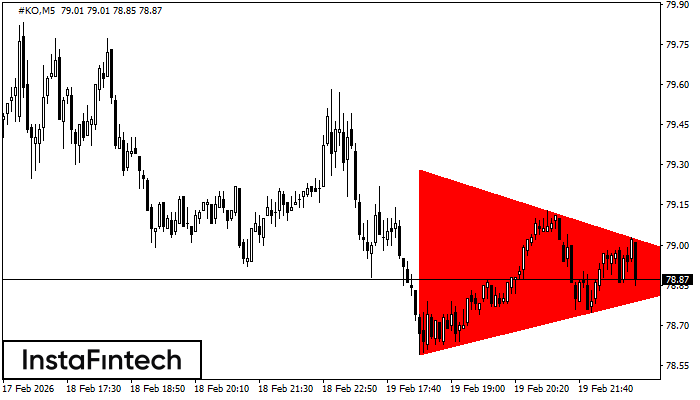
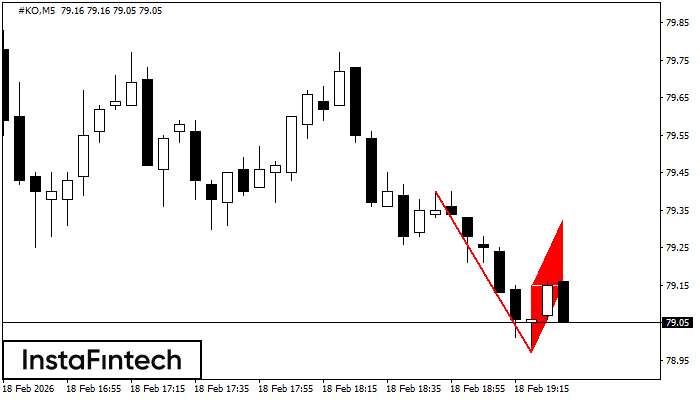
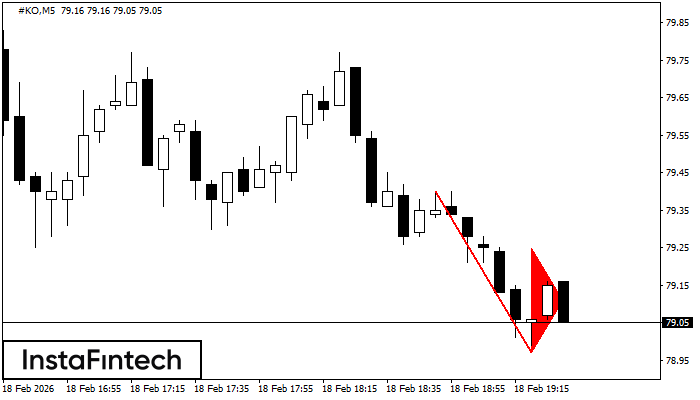
Bearish Symmetrical Triangle
According to the chart of M5, #KO formed the Bearish Symmetrical Triangle pattern. Trading recommendations: A breach of the lower border 78.59 is likely to encourage a continuation of the downward trend.
#KO H1
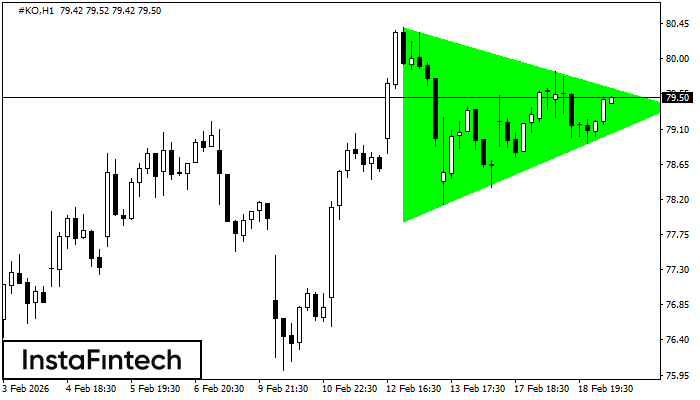
Bullish Symmetrical Triangle
According to the chart of H1, #KO formed the Bullish Symmetrical Triangle pattern. The lower border of the pattern touches the coordinates 77.91/79.39 whereas the upper border goes across 80.40/79.39. If the Bullish Symmetrical Triangle pattern is in progress, this evidently signals a further upward trend. In other words, in case the scenario comes true, the price of #KO will breach the upper border to head for 79.79.
#KO M5
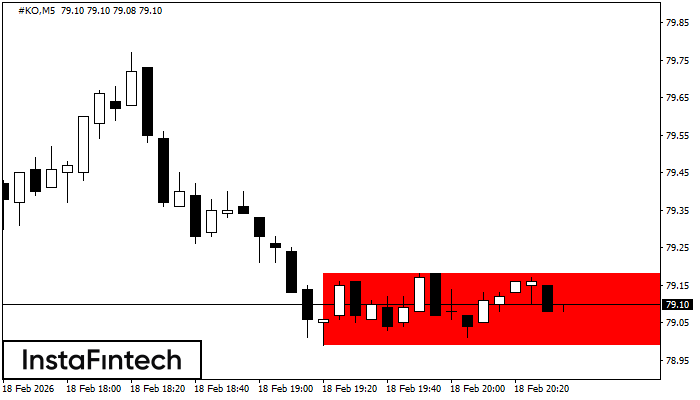
Bearish Rectangle
According to the chart of M5, #KO formed the Bearish Rectangle. The pattern indicates a trend continuation. The upper border is 79.18, the lower border is 78.99. The signal means that a short position should be opened after fixing a price below the lower border 78.99 of the Bearish Rectangle.
#KO M5
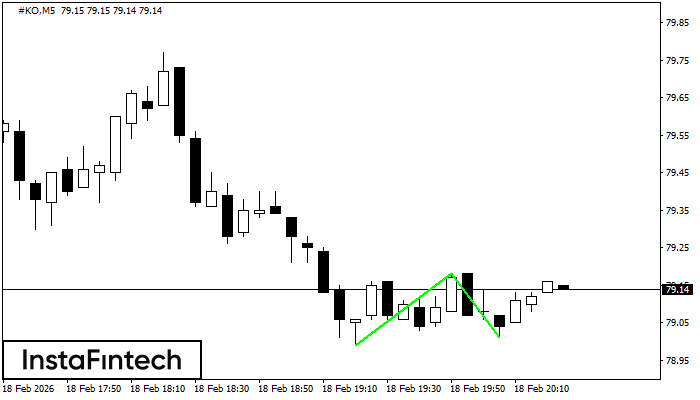
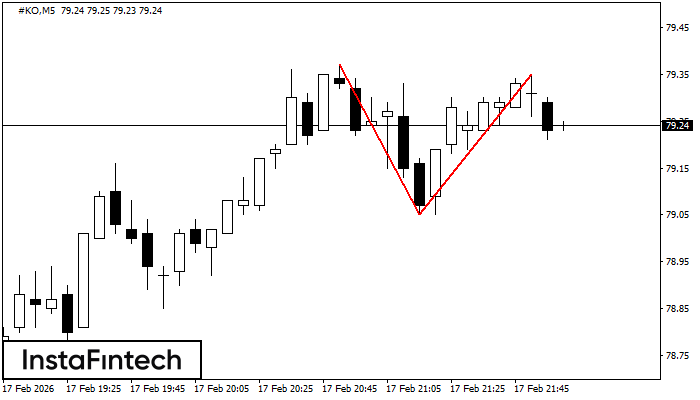
Double Bottom
The Double Bottom pattern has been formed on #KO M5; the upper boundary is 79.18; the lower boundary is 79.01. The width of the pattern is 19 points. In case of a break of the upper boundary 79.18, a change in the trend can be predicted where the width of the pattern will coincide with the distance to a possible take profit level.
#KO M5
Bearish Flag
The Bearish Flag pattern has been formed on the chart #KO M5 which signals that the downward trend will continue. If the price breaks below the low at 78.97, then it is most likely to move further downwards. The price will likely move by the number of points which equals the length of the flag pole (10 points).
#KO M5
Bearish pennant
The Bearish pennant pattern has formed on the #KO M5 chart. This pattern type is characterized by a slight slowdown after which the price will move in the direction of the original trend. In case the price fixes below the pattern’s low of 78.97, a trader will be able to successfully enter the sell position.
#KO M5
Double Top
The Double Top pattern has been formed on #KO M5. It signals that the trend has been changed from upwards to downwards. Probably, if the base of the pattern 79.05 is broken, the downward movement will continue.
#KO M5
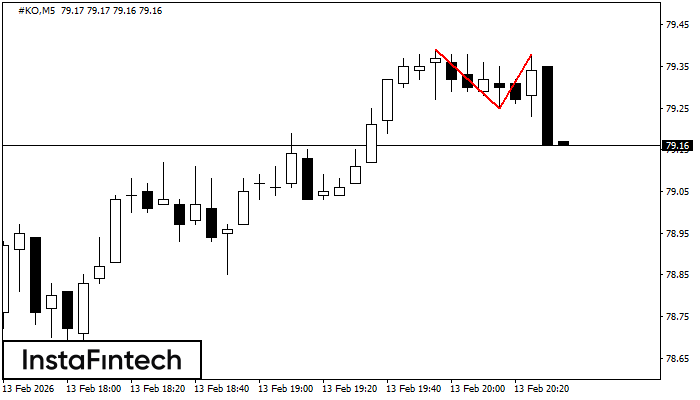
Double Top
On the chart of #KO M5 the Double Top reversal pattern has been formed. Characteristics: the upper boundary 79.38; the lower boundary 79.25; the width of the pattern 13 points. The signal: a break of the lower boundary will cause continuation of the downward trend targeting the 79.10 level.
#KO M5
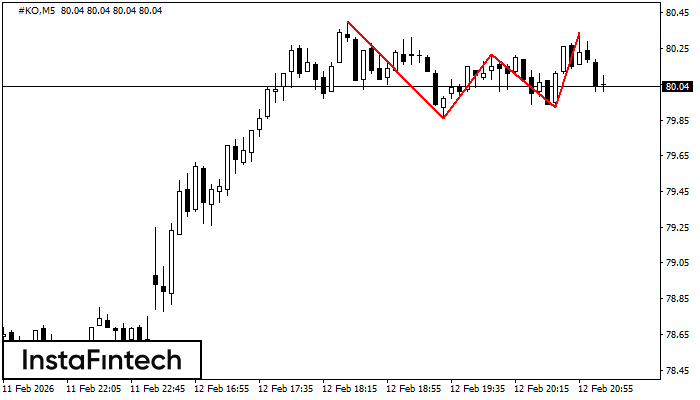
Triple Top
The Triple Top pattern has formed on the chart of the #KO M5 trading instrument. It is a reversal pattern featuring the following characteristics: resistance level 6, support level -6, and pattern’s width 54. Forecast If the price breaks through the support level 79.86, it is likely to move further down to 80.07.
#KO M5
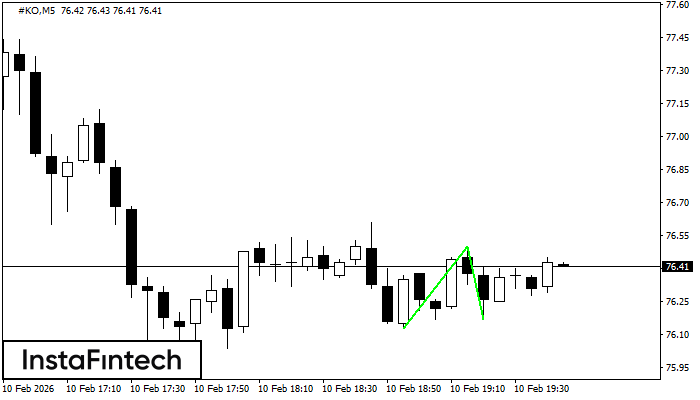
Double Bottom
The Double Bottom pattern has been formed on #KO M5. Characteristics: the support level 76.13; the resistance level 76.50; the width of the pattern 37 points. If the resistance level is broken, a change in the trend can be predicted with the first target point lying at the distance of 33 points.