 English
  Русский
 Bahasa Indonesia
 Bahasa Malay
 ไทย
ไทย Español
 Deutsch
 Български
 Français
 Tiếng Việt
 中文
中文 বাংলা
বাংলা हिन्दी
 Čeština
 Українська
 Română
FX.co ★ Patterns GBPUSD | British Pound (GBP) to US Dollar (USD) Rate in the Forex market

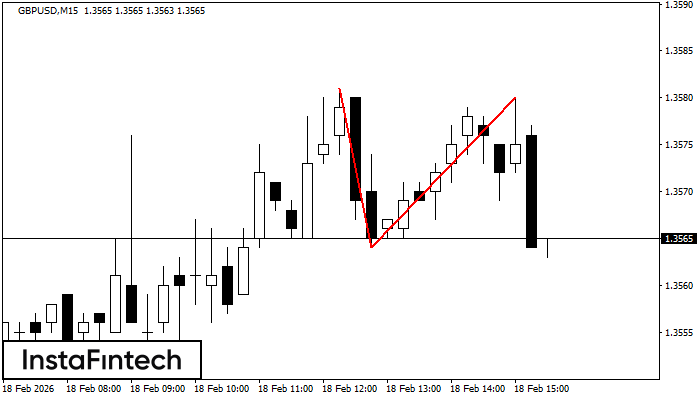
GBPUSD M15
Double Top
The Double Top reversal pattern has been formed on GBPUSD M15. Characteristics: the upper boundary 1.3581; the lower boundary 1.3564; the width of the pattern is 16 points. Sell trades are better to be opened below the lower boundary 1.3564 with a possible movements towards the 1.3542 level.
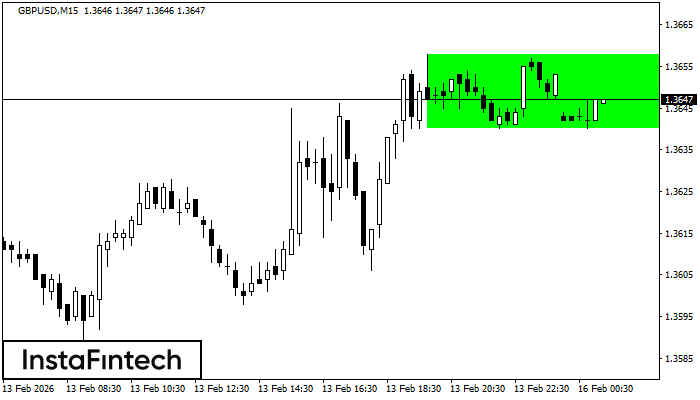
GBPUSD M15
Bullish Rectangle
According to the chart of M15, GBPUSD formed the Bullish Rectangle. The pattern indicates a trend continuation. The upper border is 1.3658, the lower border is 1.3640. The signal means that a long position should be opened above the upper border 1.3658 of the Bullish Rectangle.
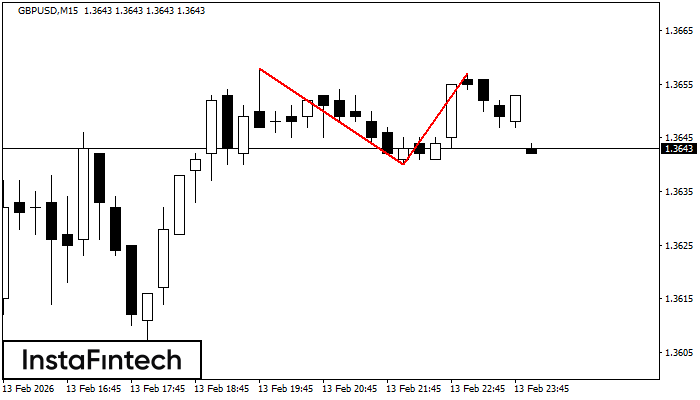
GBPUSD M15
Double Top
The Double Top reversal pattern has been formed on GBPUSD M15. Characteristics: the upper boundary 1.3658; the lower boundary 1.3640; the width of the pattern is 17 points. Sell trades are better to be opened below the lower boundary 1.3640 with a possible movements towards the 1.3618 level.
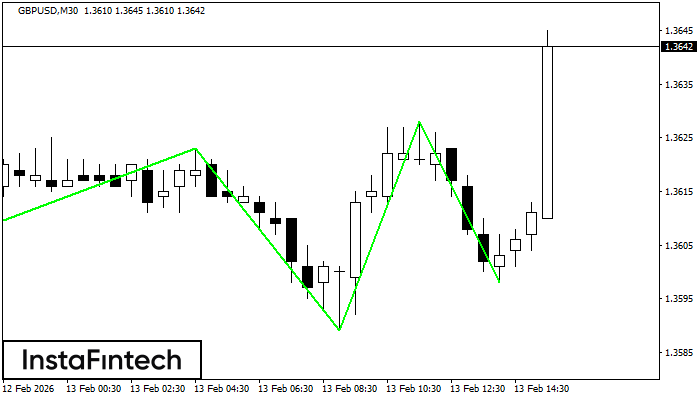
GBPUSD M30
Inverse Head and Shoulder
According to the chart of M30, GBPUSD produced the pattern termed the Inverse Head and Shoulder. The Head is fixed at 1.3589 while the median line of the Neck is set at 1.3623/1.3628. The formation of the Inverse Head and Shoulder Pattern clearly indicates a reversal of the downward trend. In means that in case the scenario comes true, the price of GBPUSD will go towards 1.3658.
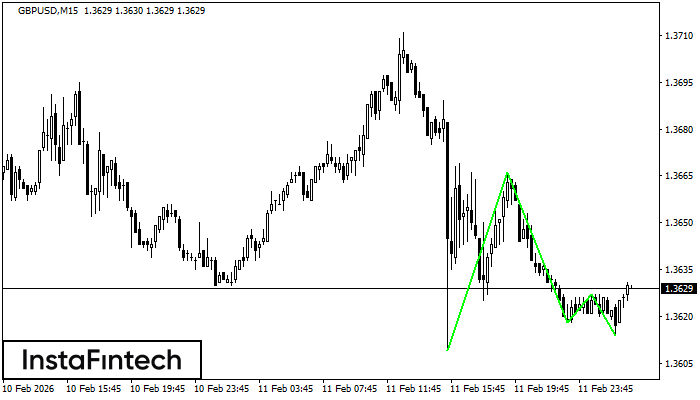
GBPUSD M5
Double Top
The Double Top pattern has been formed on GBPUSD M5. It signals that the trend has been changed from upwards to downwards. Probably, if the base of the pattern 1.3620 is broken, the downward movement will continue.
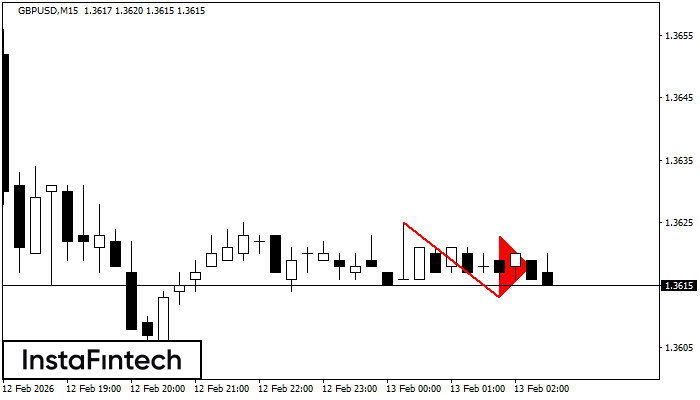
GBPUSD M15
Bearish pennant
The Bearish pennant pattern has formed on the GBPUSD M15 chart. This pattern type is characterized by a slight slowdown after which the price will move in the direction of the original trend. In case the price fixes below the pattern’s low of 1.3613, a trader will be able to successfully enter the sell position.
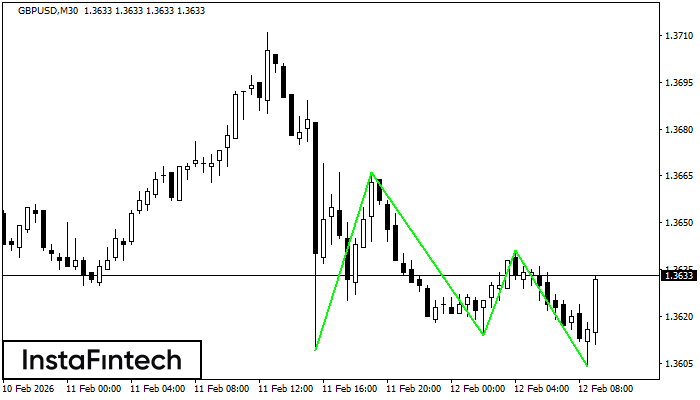
GBPUSD M30
Triple Bottom
The Triple Bottom pattern has been formed on GBPUSD M30. It has the following characteristics: resistance level 1.3666/1.3641; support level 1.3609/1.3604; the width is 57 points. In the event of a breakdown of the resistance level of 1.3666, the price is likely to continue an upward movement at least to 1.3644.
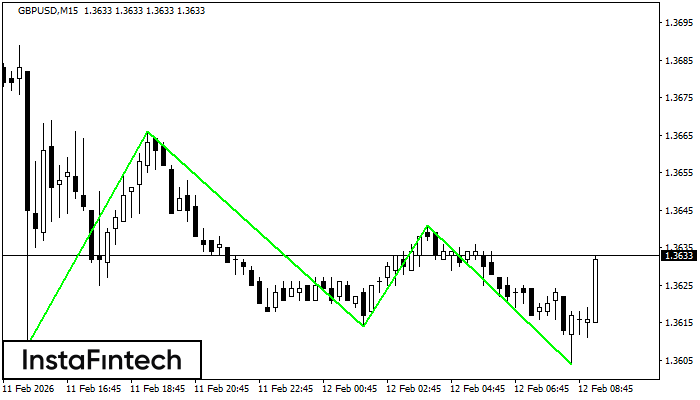
GBPUSD M15
Triple Bottom
The Triple Bottom pattern has formed on the chart of GBPUSD M15. Features of the pattern: The lower line of the pattern has coordinates 1.3666 with the upper limit 1.3666/1.3641, the projection of the width is 57 points. The formation of the Triple Bottom pattern most likely indicates a change in the trend from downward to upward. This means that in the event of a breakdown of the resistance level 1.3609, the price is most likely to continue the upward movement.
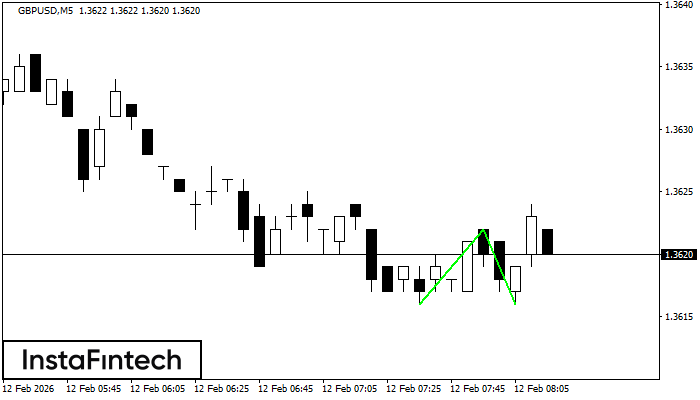
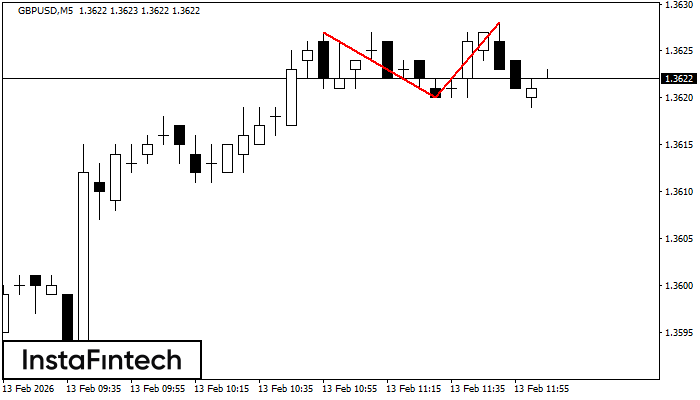
GBPUSD M5
Double Bottom
The Double Bottom pattern has been formed on GBPUSD M5. This formation signals a reversal of the trend from downwards to upwards. The signal is that a buy trade should be opened after the upper boundary of the pattern 1.3622 is broken. The further movements will rely on the width of the current pattern 6 points.
GBPUSD M15
Triple Bottom
The Triple Bottom pattern has formed on the chart of GBPUSD M15. Features of the pattern: The lower line of the pattern has coordinates 1.3666 with the upper limit 1.3666/1.3627, the projection of the width is 57 points. The formation of the Triple Bottom pattern most likely indicates a change in the trend from downward to upward. This means that in the event of a breakdown of the resistance level 1.3609, the price is most likely to continue the upward movement.