 English
  Русский
 Bahasa Indonesia
 Bahasa Malay
 ไทย
ไทย Español
 Deutsch
 Български
 Français
 Tiếng Việt
 中文
中文 বাংলা
বাংলা हिन्दी
 Čeština
 Українська
 Română
FX.co ★ Patterns GBPJPY | British Pound (GBP) to Japanese Yen (JPY) Rate in the Forex market

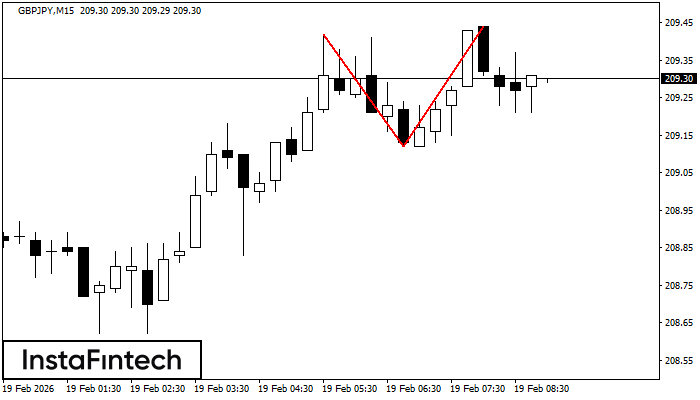
GBPJPY M15
Double Top
The Double Top reversal pattern has been formed on GBPJPY M15. Characteristics: the upper boundary 209.42; the lower boundary 209.12; the width of the pattern is 32 points. Sell trades are better to be opened below the lower boundary 209.12 with a possible movements towards the 208.90 level.
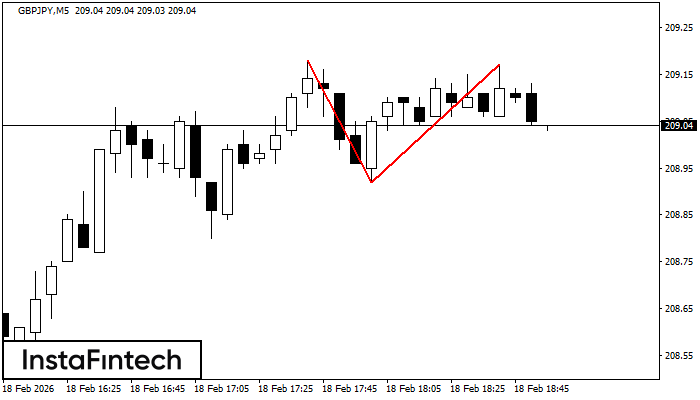
GBPJPY M5
Double Top
The Double Top pattern has been formed on GBPJPY M5. It signals that the trend has been changed from upwards to downwards. Probably, if the base of the pattern 208.92 is broken, the downward movement will continue.
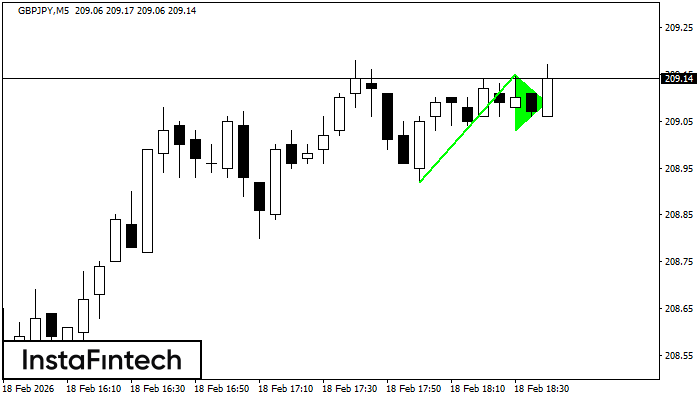
GBPJPY M5
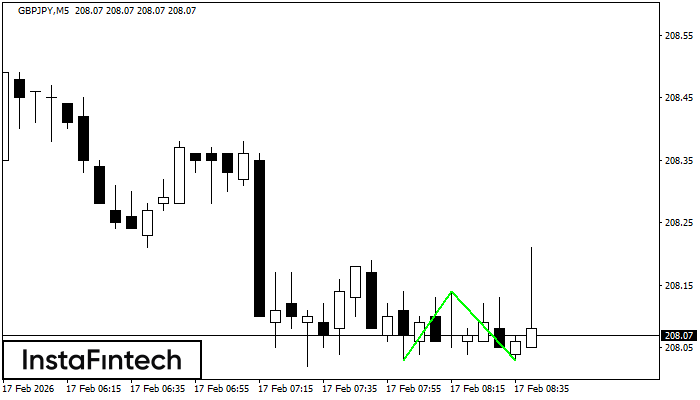
Bullish pennant
The Bullish pennant graphic pattern has formed on the GBPJPY M5 instrument. This pattern type falls under the category of continuation patterns. In this case, if the quote can breaks out high, is expected to continue the upward trend to level 209.30.
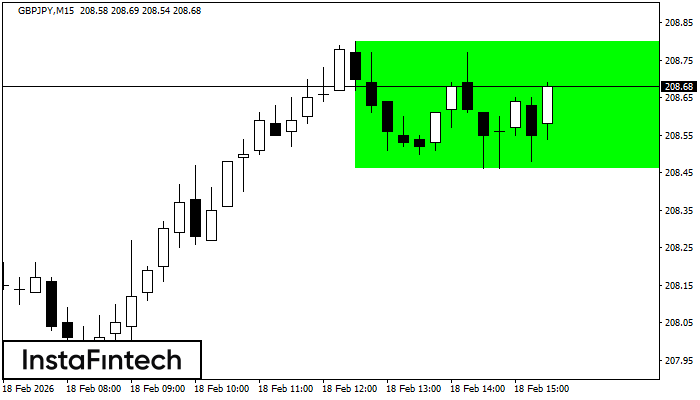
GBPJPY M15
Bullish Rectangle
According to the chart of M15, GBPJPY formed the Bullish Rectangle. This type of a pattern indicates a trend continuation. It consists of two levels: resistance 208.80 and support 208.46. In case the resistance level 208.80 - 208.80 is broken, the instrument is likely to follow the bullish trend.
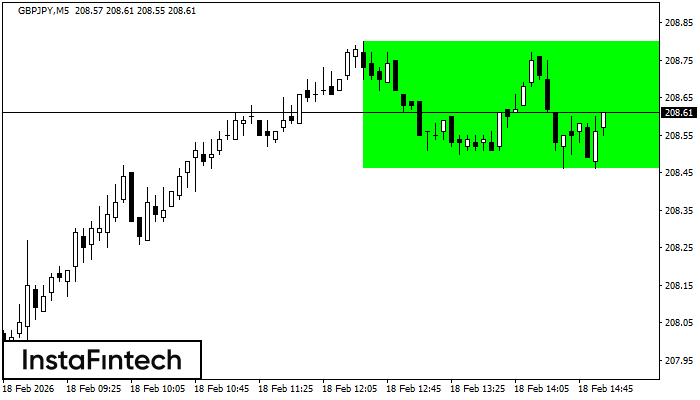
GBPJPY M5
Bullish Rectangle
According to the chart of M5, GBPJPY formed the Bullish Rectangle. This type of a pattern indicates a trend continuation. It consists of two levels: resistance 208.80 and support 208.46. In case the resistance level 208.80 - 208.80 is broken, the instrument is likely to follow the bullish trend.
GBPJPY M5
Double Bottom
The Double Bottom pattern has been formed on GBPJPY M5. Characteristics: the support level 207.62; the resistance level 207.89; the width of the pattern 27 points. If the resistance level is broken, a change in the trend can be predicted with the first target point lying at the distance of 29 points.
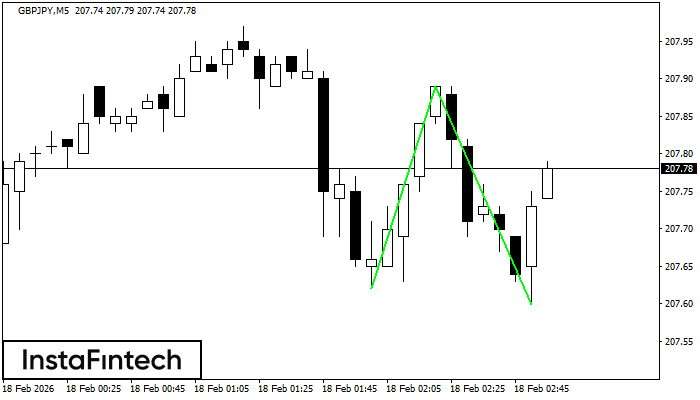
GBPJPY M5
Double Top
The Double Top reversal pattern has been formed on GBPJPY M5. Characteristics: the upper boundary 207.89; the lower boundary 207.74; the width of the pattern is 16 points. Sell trades are better to be opened below the lower boundary 207.74 with a possible movements towards the 207.59 level.
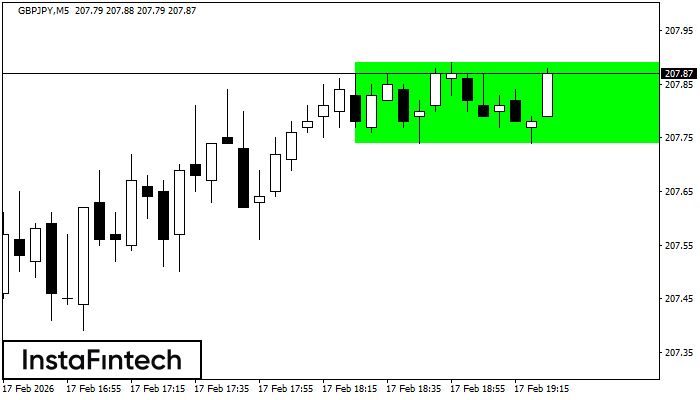
GBPJPY M5
Bullish Rectangle
According to the chart of M5, GBPJPY formed the Bullish Rectangle. This type of a pattern indicates a trend continuation. It consists of two levels: resistance 207.89 and support 207.74. In case the resistance level 207.89 - 207.89 is broken, the instrument is likely to follow the bullish trend.
GBPJPY M5
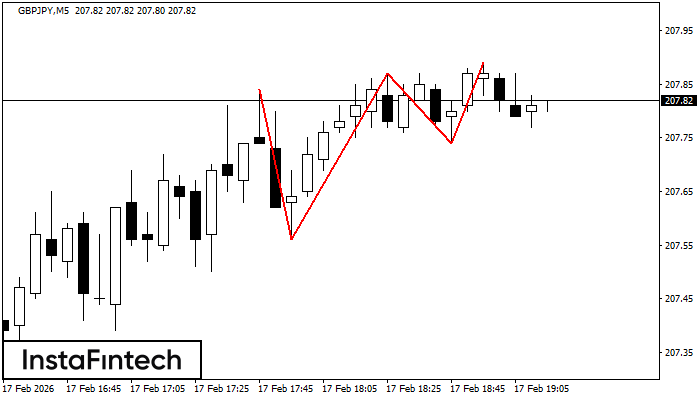
Triple Top
The Triple Top pattern has formed on the chart of the GBPJPY M5 trading instrument. It is a reversal pattern featuring the following characteristics: resistance level -5, support level -18, and pattern’s width 28. Forecast If the price breaks through the support level 207.56, it is likely to move further down to 207.72.
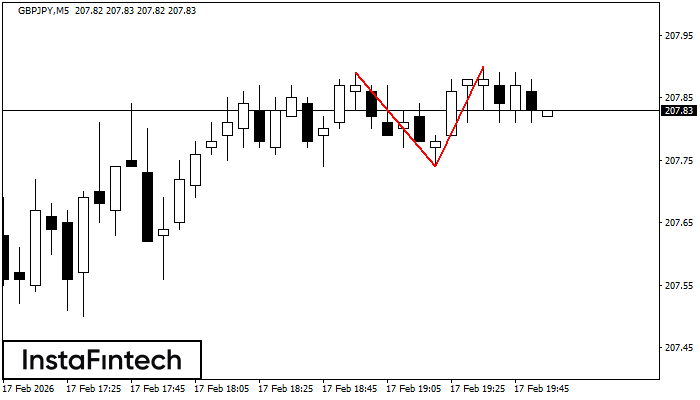
GBPJPY M5
Double Bottom
The Double Bottom pattern has been formed on GBPJPY M5; the upper boundary is 208.14; the lower boundary is 208.03. The width of the pattern is 11 points. In case of a break of the upper boundary 208.14, a change in the trend can be predicted where the width of the pattern will coincide with the distance to a possible take profit level.