 English
  Русский
 Bahasa Indonesia
 Bahasa Malay
 ไทย
ไทย Español
 Deutsch
 Български
 Français
 Tiếng Việt
 中文
中文 বাংলা
বাংলা हिन्दी
 Čeština
 Українська
 Română
FX.co ★ Patterns #FB | Facebook, Inc. Stock Price

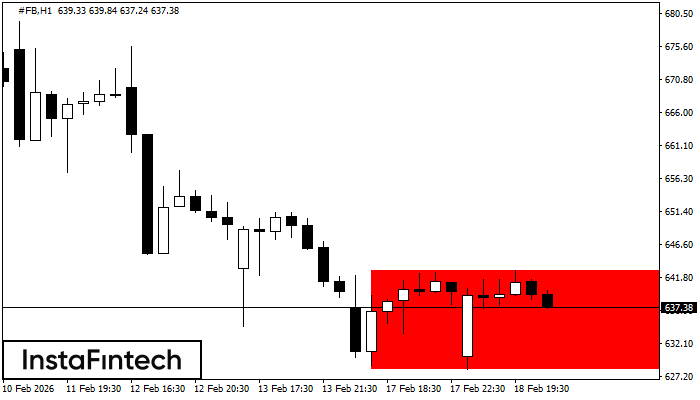
#FB H1
Bearish Rectangle
According to the chart of H1, #FB formed the Bearish Rectangle. The pattern indicates a trend continuation. The upper border is 642.87, the lower border is 628.26. The signal means that a short position should be opened after fixing a price below the lower border 628.26 of the Bearish Rectangle.
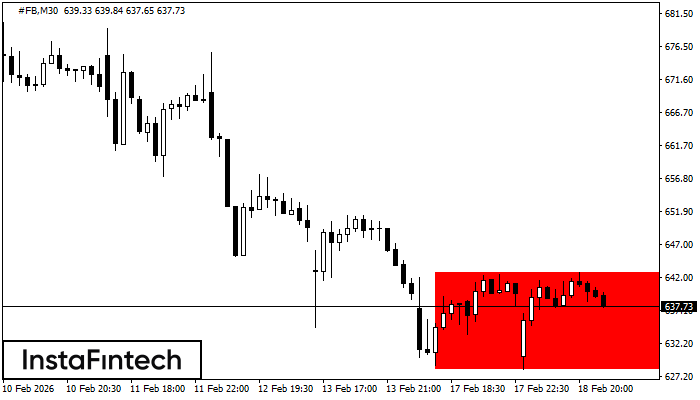
#FB M30
Bearish Rectangle
According to the chart of M30, #FB formed the Bearish Rectangle. The pattern indicates a trend continuation. The upper border is 642.87, the lower border is 628.26. The signal means that a short position should be opened after fixing a price below the lower border 628.26 of the Bearish Rectangle.
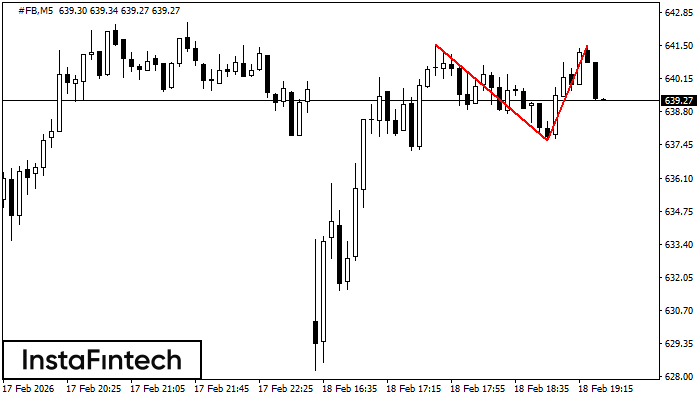
#FB M5
Double Top
On the chart of #FB M5 the Double Top reversal pattern has been formed. Characteristics: the upper boundary 641.49; the lower boundary 637.65; the width of the pattern 384 points. The signal: a break of the lower boundary will cause continuation of the downward trend targeting the 637.50 level.
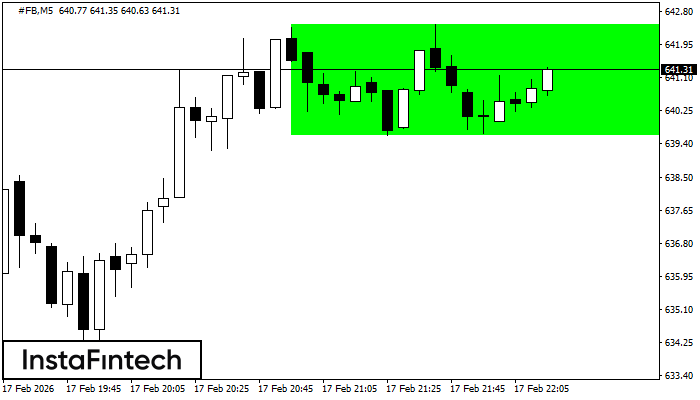
#FB M5
Bullish Rectangle
According to the chart of M5, #FB formed the Bullish Rectangle. The pattern indicates a trend continuation. The upper border is 642.46, the lower border is 639.61. The signal means that a long position should be opened above the upper border 642.46 of the Bullish Rectangle.
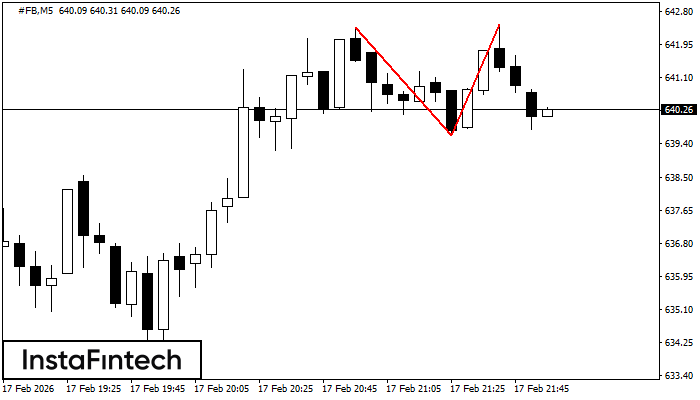
#FB M5
Double Top
On the chart of #FB M5 the Double Top reversal pattern has been formed. Characteristics: the upper boundary 642.46; the lower boundary 639.61; the width of the pattern 285 points. The signal: a break of the lower boundary will cause continuation of the downward trend targeting the 639.46 level.
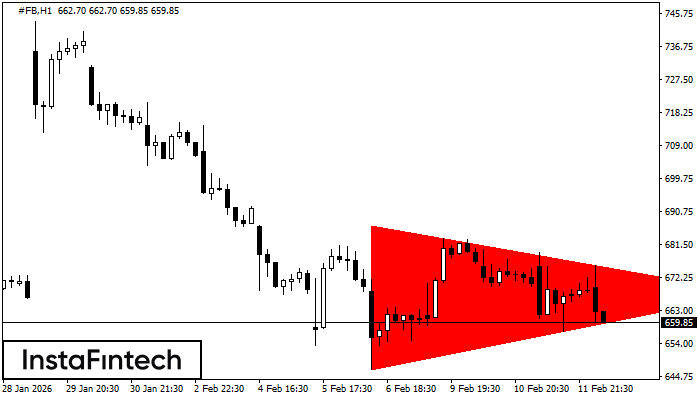
#FB H1
Bearish Symmetrical Triangle
According to the chart of H1, #FB formed the Bearish Symmetrical Triangle pattern. Description: The lower border is 646.52/667.72 and upper border is 686.78/667.72. The pattern width is measured on the chart at -4026 pips. The formation of the Bearish Symmetrical Triangle pattern evidently signals a continuation of the downward trend. In other words, if the scenario comes true and #FB breaches the lower border, the price could continue its move toward 667.32.
#FB M5
Double Top
The Double Top reversal pattern has been formed on #FB M5. Characteristics: the upper boundary 675.39; the lower boundary 657.13; the width of the pattern is 1852 points. Sell trades are better to be opened below the lower boundary 657.13 with a possible movements towards the 656.98 level.
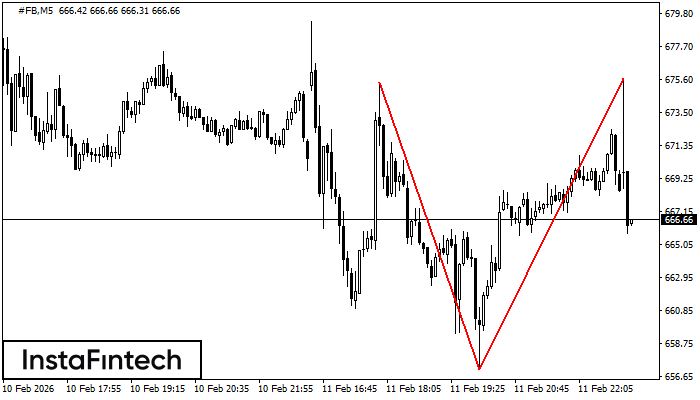
#FB M5
Double Bottom
The Double Bottom pattern has been formed on #FB M5. This formation signals a reversal of the trend from downwards to upwards. The signal is that a buy trade should be opened after the upper boundary of the pattern 672.10 is broken. The further movements will rely on the width of the current pattern 229 points.
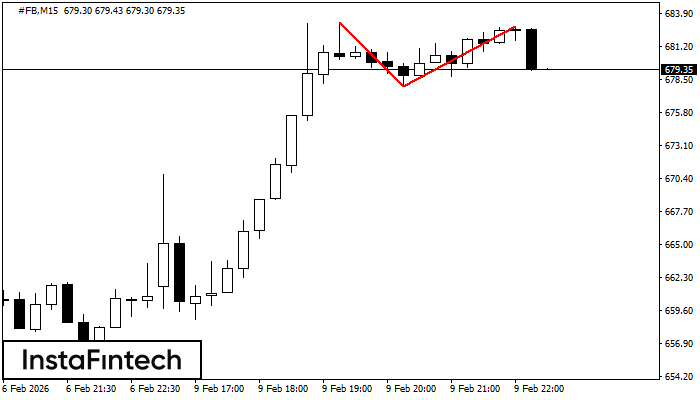
#FB M15
Double Top
The Double Top reversal pattern has been formed on #FB M15. Characteristics: the upper boundary 683.20; the lower boundary 677.96; the width of the pattern is 492 points. Sell trades are better to be opened below the lower boundary 677.96 with a possible movements towards the 677.73 level.

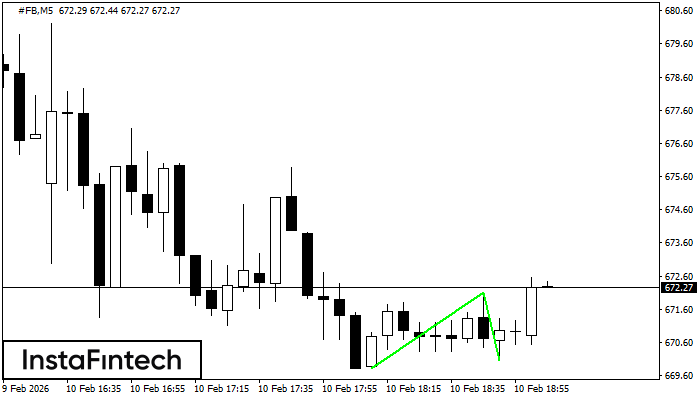
#FB M5
Triple Top
On the chart of the #FB M5 trading instrument, the Triple Top pattern that signals a trend change has formed. It is possible that after formation of the third peak, the price will try to break through the resistance level 677.96, where we advise to open a trading position for sale. Take profit is the projection of the pattern’s width, which is 524 points.