 English
  Русский
 Bahasa Indonesia
 Bahasa Malay
 ไทย
ไทย Español
 Deutsch
 Български
 Français
 Tiếng Việt
 中文
中文 বাংলা
বাংলা हिन्दी
 Čeština
 Українська
 Română
FX.co ★ Patterns EURCAD | Euro (EUR) to Canadian Dollar (CAD) Rate in the Forex market

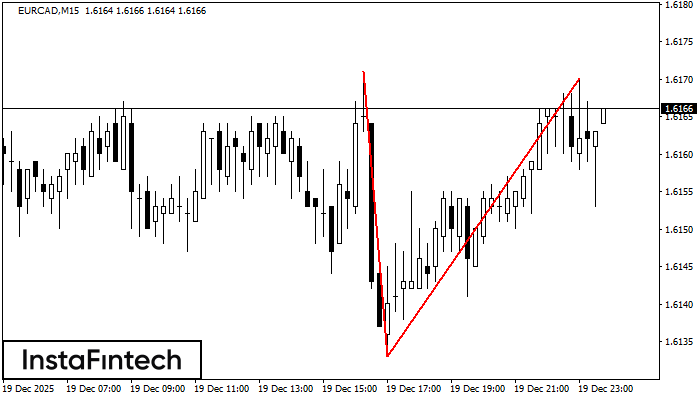
EURCAD M15
Double Top
The Double Top pattern has been formed on EURCAD M15. It signals that the trend has been changed from upwards to downwards. Probably, if the base of the pattern 1.6133 is broken, the downward movement will continue.
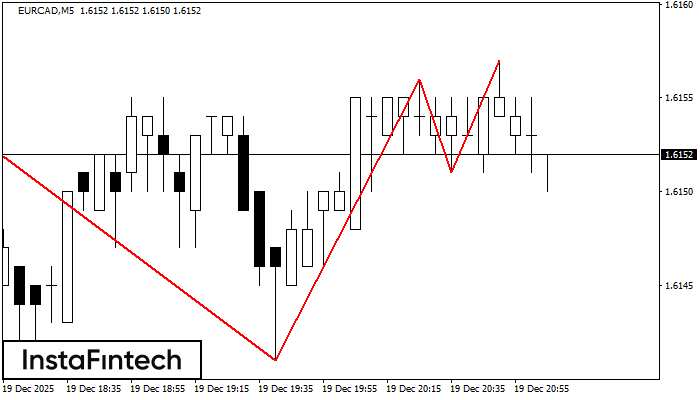
EURCAD M5
Triple Top
The Triple Top pattern has formed on the chart of the EURCAD M5 trading instrument. It is a reversal pattern featuring the following characteristics: resistance level -2, support level -10, and pattern’s width 14. Forecast If the price breaks through the support level 1.6141, it is likely to move further down to 1.6141.
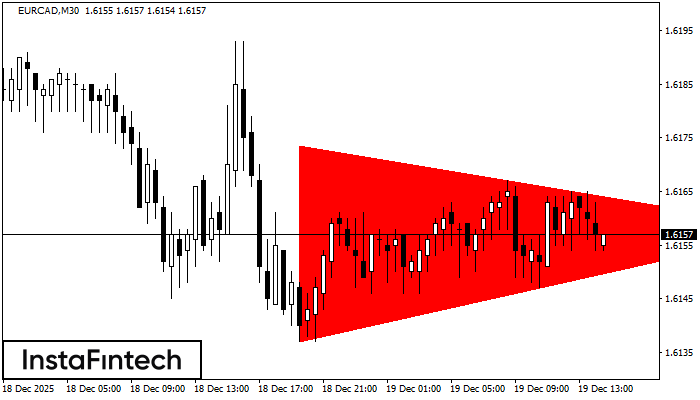
EURCAD M30
Bearish Symmetrical Triangle
According to the chart of M30, EURCAD formed the Bearish Symmetrical Triangle pattern. Trading recommendations: A breach of the lower border 1.6137 is likely to encourage a continuation of the downward trend.
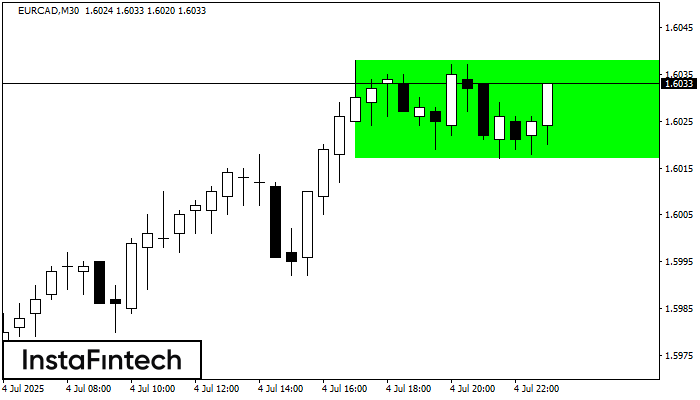
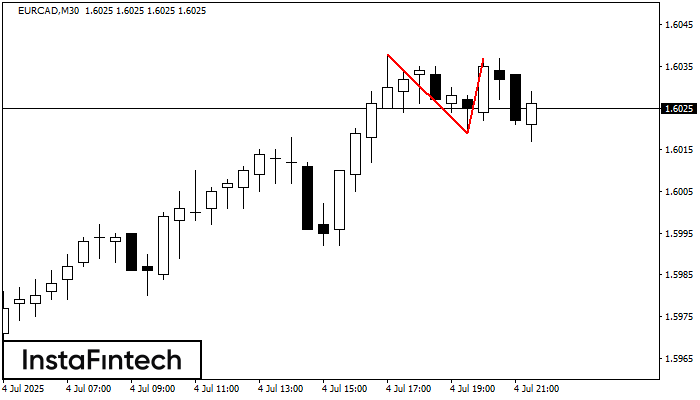
EURCAD M30
Bullish Rectangle
According to the chart of M30, EURCAD formed the Bullish Rectangle which is a pattern of a trend continuation. The pattern is contained within the following borders: the lower border 1.6017 – 1.6017 and upper border 1.6038 – 1.6038. In case the upper border is broken, the instrument is likely to follow the upward trend.
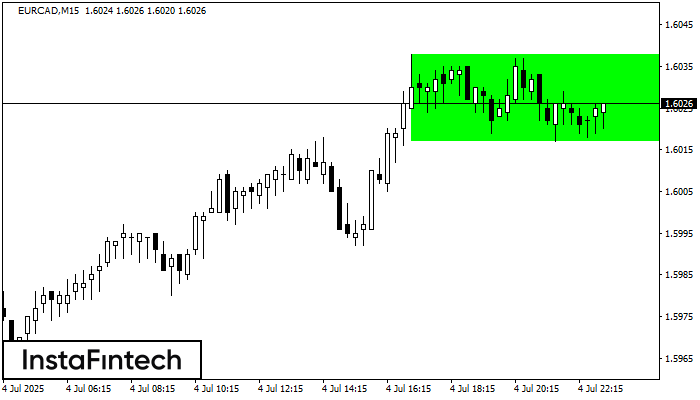
EURCAD M15
Bullish Rectangle
According to the chart of M15, EURCAD formed the Bullish Rectangle which is a pattern of a trend continuation. The pattern is contained within the following borders: the lower border 1.6017 – 1.6017 and upper border 1.6038 – 1.6038. In case the upper border is broken, the instrument is likely to follow the upward trend.
EURCAD M30
Double Top
The Double Top pattern has been formed on EURCAD M30. It signals that the trend has been changed from upwards to downwards. Probably, if the base of the pattern 1.6019 is broken, the downward movement will continue.
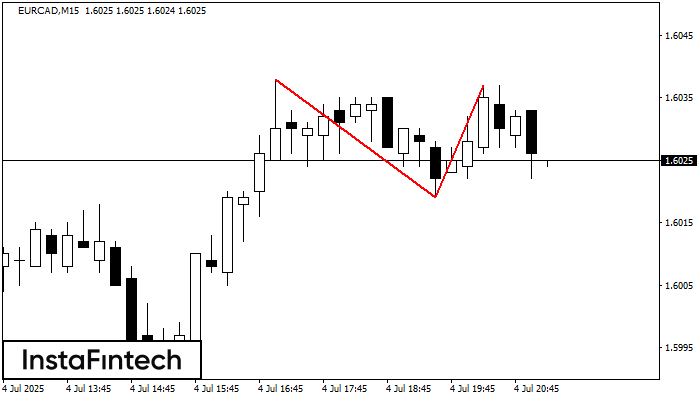
EURCAD M15
Double Top
The Double Top pattern has been formed on EURCAD M15. It signals that the trend has been changed from upwards to downwards. Probably, if the base of the pattern 1.6019 is broken, the downward movement will continue.
EURCAD M5
Double Bottom
The Double Bottom pattern has been formed on EURCAD M5. Characteristics: the support level 1.5936; the resistance level 1.5947; the width of the pattern 11 points. If the resistance level is broken, a change in the trend can be predicted with the first target point lying at the distance of 10 points.
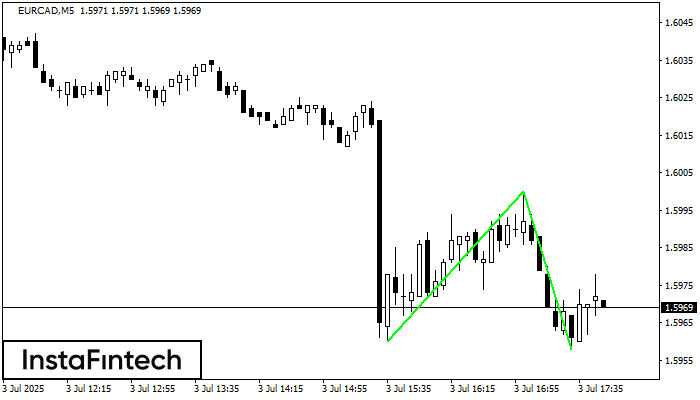
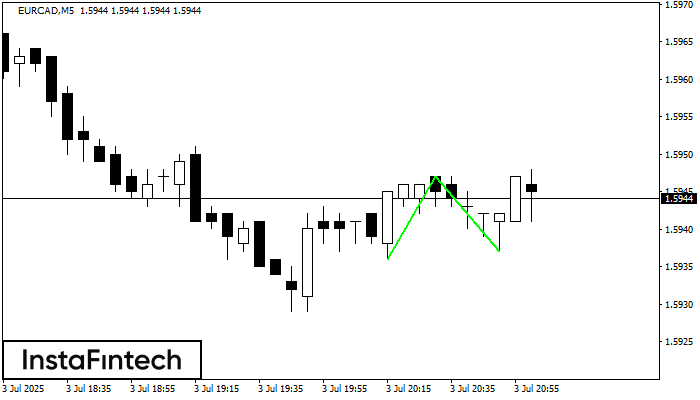
EURCAD M5
Double Bottom
The Double Bottom pattern has been formed on EURCAD M5. This formation signals a reversal of the trend from downwards to upwards. The signal is that a buy trade should be opened after the upper boundary of the pattern 1.6000 is broken. The further movements will rely on the width of the current pattern 40 points.
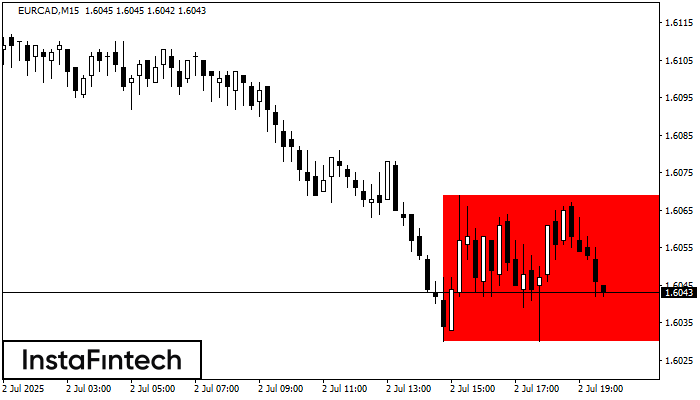
EURCAD M15
Bearish Rectangle
According to the chart of M15, EURCAD formed the Bearish Rectangle. This type of a pattern indicates a trend continuation. It consists of two levels: resistance 1.6069 - 0.0000 and support 1.6030 – 1.6030. In case the resistance level 1.6030 - 1.6030 is broken, the instrument is likely to follow the bearish trend.