 English
  Русский
 Bahasa Indonesia
 Bahasa Malay
 ไทย
ไทย Español
 Deutsch
 Български
 Français
 Tiếng Việt
 中文
中文 বাংলা
বাংলা हिन्दी
 Čeština
 Українська
 Română
FX.co ★ Patterns #EBAY | eBay Inc. Stock Price

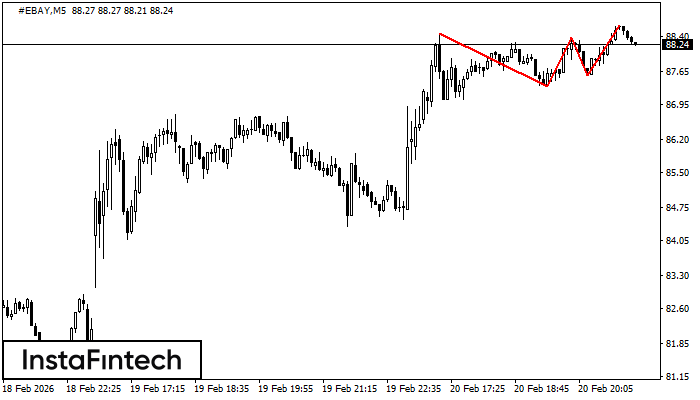
#EBAY M5
Triple Top
The Triple Top pattern has formed on the chart of the #EBAY M5. Features of the pattern: borders have an ascending angle; the lower line of the pattern has the coordinates 87.35/87.57 with the upper limit 88.48/88.65; the projection of the width is 113 points. The formation of the Triple Top figure most likely indicates a change in the trend from upward to downward. This means that in the event of a breakdown of the support level of 87.35, the price is most likely to continue the downward movement.
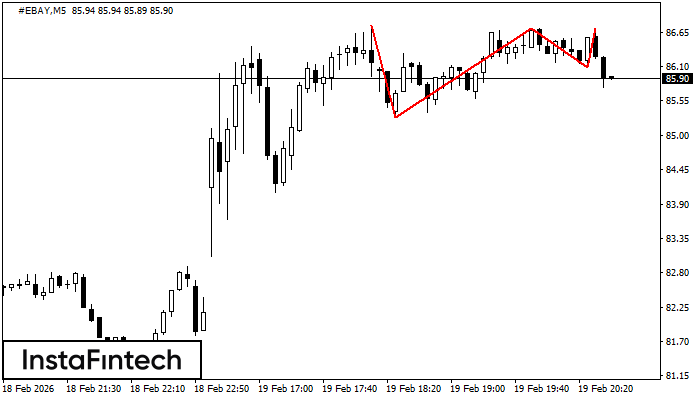
#EBAY M5
Triple Top
On the chart of the #EBAY M5 trading instrument, the Triple Top pattern that signals a trend change has formed. It is possible that after formation of the third peak, the price will try to break through the resistance level 85.29, where we advise to open a trading position for sale. Take profit is the projection of the pattern’s width, which is 146 points.
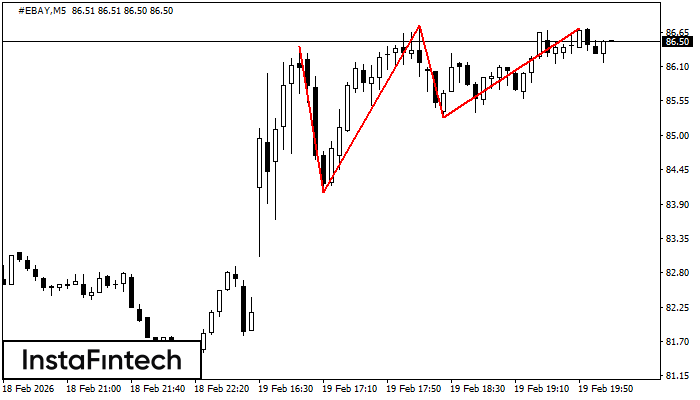
#EBAY M5
Triple Top
On the chart of the #EBAY M5 trading instrument, the Triple Top pattern that signals a trend change has formed. It is possible that after formation of the third peak, the price will try to break through the resistance level 84.08, where we advise to open a trading position for sale. Take profit is the projection of the pattern’s width, which is 234 points.
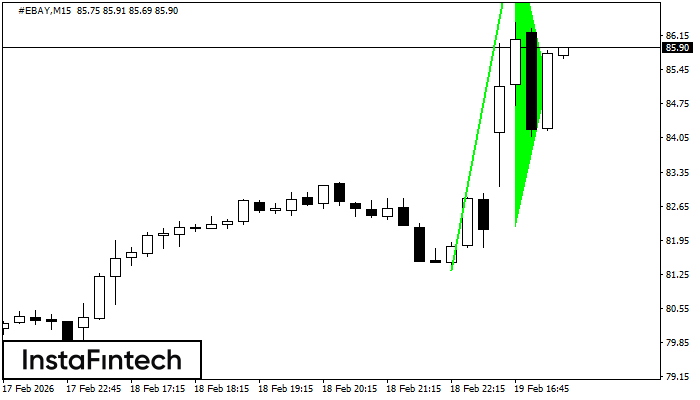
#EBAY M15
Bullish pennant
The Bullish pennant signal – Trading instrument #EBAY M15, continuation pattern. Forecast: it is possible to set up a buy position above the pattern’s high of 88.15, with the prospect of the next move being a projection of the flagpole height.
#EBAY M5
Head and Shoulders
According to the chart of M5, #EBAY formed the Head and Shoulders pattern. The Head’s top is set at 83.13 while the median line of the Neck is found at 82.45/82.44. The formation of the Head and Shoulders pattern evidently signals a reversal of the upward trend. In other words, in case the scenario comes true, the price of #EBAY will go towards 82.29.
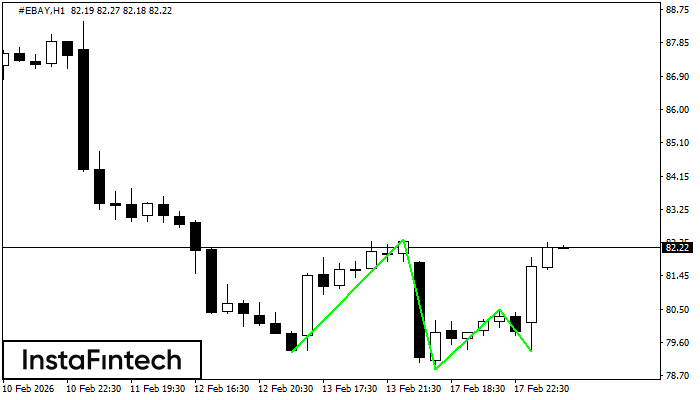
#EBAY H1
Triple Bottom
The Triple Bottom pattern has been formed on #EBAY H1. It has the following characteristics: resistance level 82.44/80.50; support level 79.33/79.35; the width is 311 points. In the event of a breakdown of the resistance level of 82.44, the price is likely to continue an upward movement at least to 79.26.
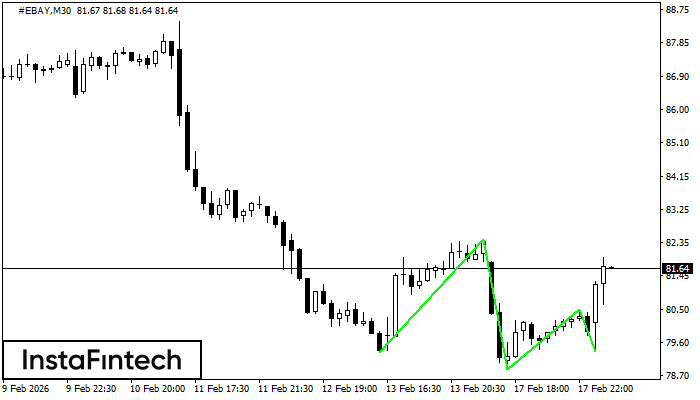
#EBAY M30
Triple Bottom
The Triple Bottom pattern has formed on the chart of #EBAY M30. Features of the pattern: The lower line of the pattern has coordinates 82.44 with the upper limit 82.44/80.50, the projection of the width is 311 points. The formation of the Triple Bottom pattern most likely indicates a change in the trend from downward to upward. This means that in the event of a breakdown of the resistance level 79.33, the price is most likely to continue the upward movement.
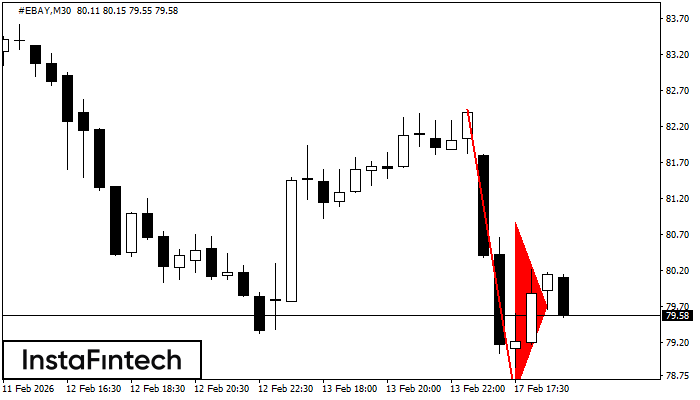
#EBAY M30
Bearish pennant
The Bearish pennant pattern has formed on the #EBAY M30 chart. The pattern signals continuation of the downtrend in case the pennant’s low of 78.51 is broken through. Recommendations: Place the sell stop pending order 10 pips below the pattern’s low. Place the take profit order at the projection distance of the flagpole height.
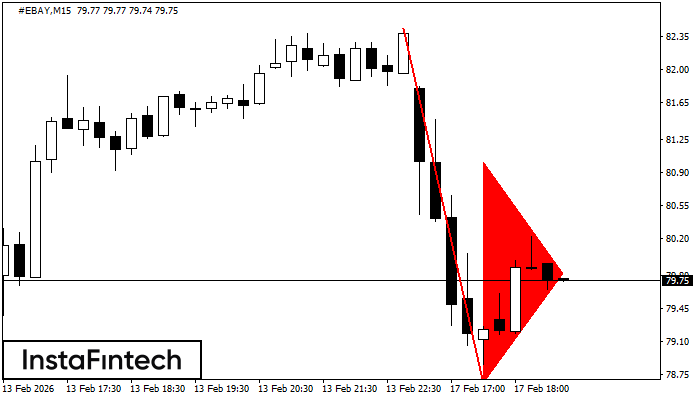
#EBAY M15
Bearish pennant
The Bearish pennant pattern has formed on the #EBAY M15 chart. The pattern signals continuation of the downtrend in case the pennant’s low of 78.65 is broken through. Recommendations: Place the sell stop pending order 10 pips below the pattern’s low. Place the take profit order at the projection distance of the flagpole height.
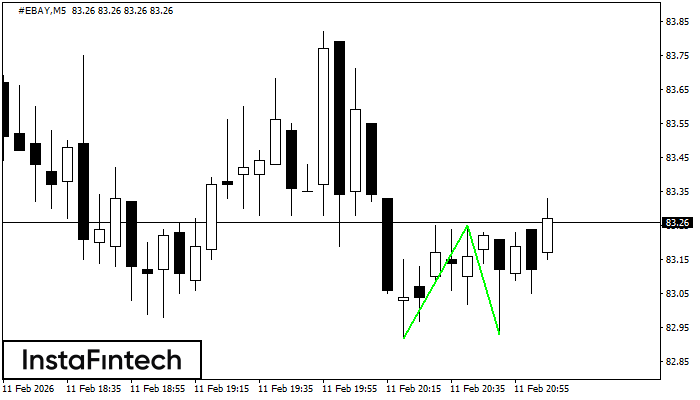
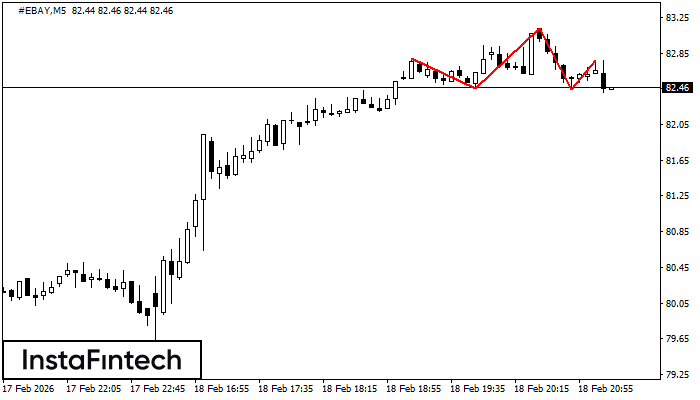
#EBAY M5
Double Bottom
The Double Bottom pattern has been formed on #EBAY M5. Characteristics: the support level 82.92; the resistance level 83.25; the width of the pattern 33 points. If the resistance level is broken, a change in the trend can be predicted with the first target point lying at the distance of 32 points.