 English
  Русский
 Bahasa Indonesia
 Bahasa Malay
 ไทย
ไทย Español
 Deutsch
 Български
 Français
 Tiếng Việt
 中文
中文 বাংলা
বাংলা हिन्दी
 Čeština
 Українська
 Română
FX.co ★ Analytics #BIDU | Baidu, Inc. Stock Price

Forex Analysis
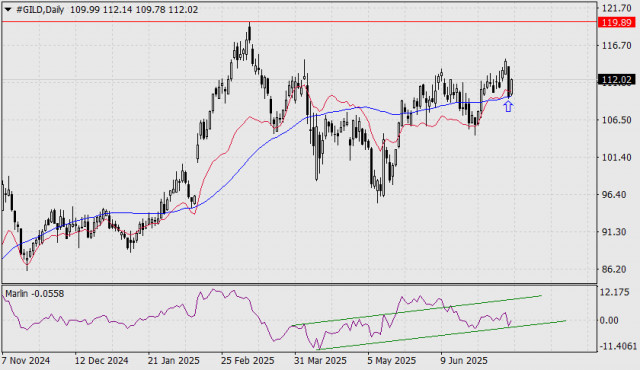
Stock Market Buying and Selling – July 15, 2025
Buying shares of Gilead Sciences (#GILD) Gilead Sciences is an American pharmaceutical company. Yesterday, the company's stock price made a decisive reversal from the MACD line support on the daily...
 Relevance until2025-07-16
Analytical expert:
2025-07-15
Forex Analysis
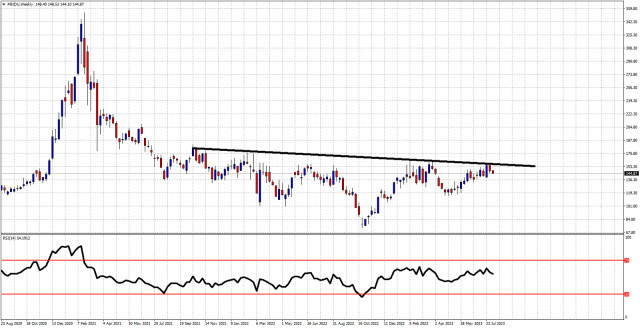
Weekly technical analysis on BIDU stock price for September 5th, 2023.
In previous posts we talked about the potential inverted head and shoulders pattern in BIDU stock chart. In the weekly chart we clearly see another attempt by bulls to challenge...
 Long-term review
Analytical expert:
2023-09-05
Forex Analysis
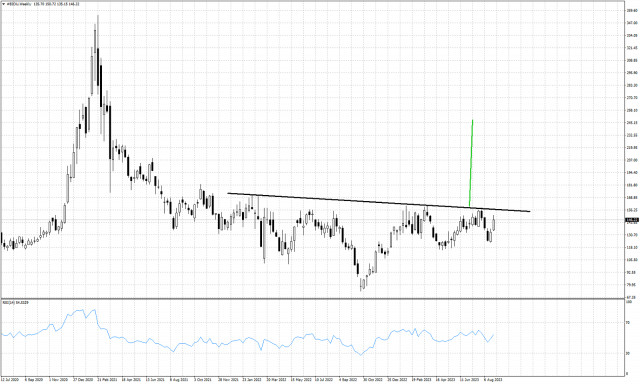
Technical analysis on BIDU stock price for week starting August 7th, 2023.
BIDU stock price has started trading this week under pressure around $144-$145 after last week's rejection at $156.75. As we mentioned in previous posts, BIDU stock price has formed...
Long-term reviewAnalytical expert:
2023-08-07
Forex Analysis
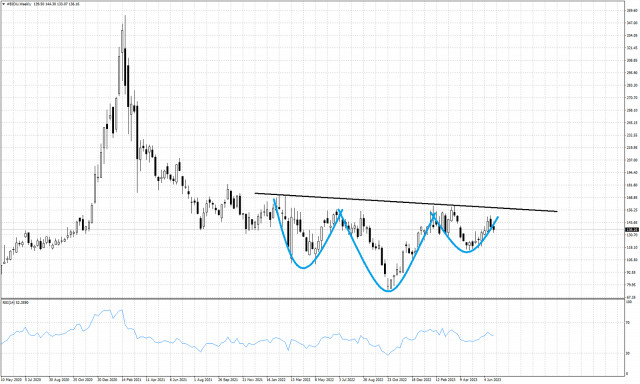
Inverted head and Shoulders pattern in BIDU stock.
The Bidu stock price is trading around $136. Price has mostly been moving sideways over the last 2 years. Today we focus on the inverted head and shoulders pattern...
Long-term reviewAnalytical expert:
2023-06-30
Forex Analysis
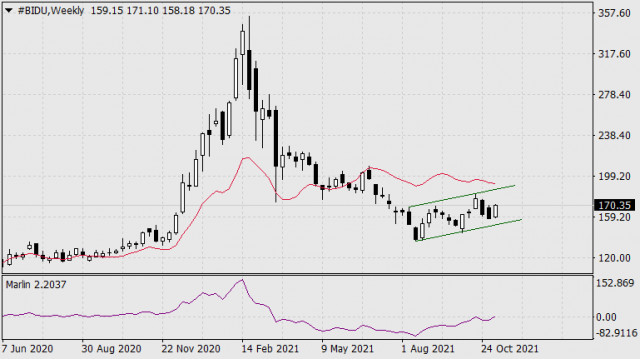
Buying and selling on stock market on November 15
Buying Baidu's stock is hedged by selling Comcast. Buying Baidu's stock(#BIDU). Chinese Internet service, search engine. On the weekly chart, the signal line of the Marlin oscillator has overcome...
Relevance until2021-11-16Analytical expert:
2021-11-15
Forex Analysis
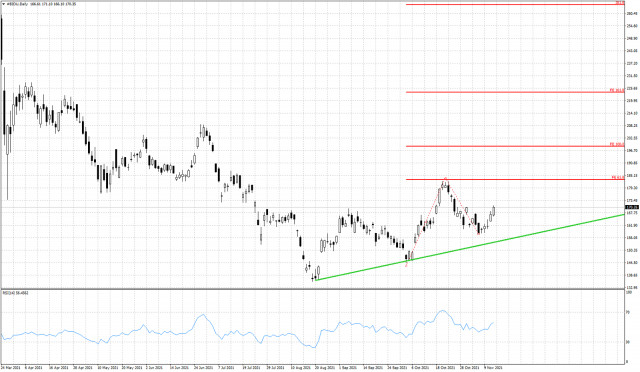
Bidu stock price has bullish potential.
BIDU stock price is making higher highs and higher lows after the major low in August around $135. Price has potential of reaching $200 from current levels at $170...
Relevance until2021-11-28Analytical expert:
2021-11-14