 English
  Русский
 Bahasa Indonesia
 Bahasa Malay
 ไทย
ไทย Español
 Deutsch
 Български
 Français
 Tiếng Việt
 中文
中文 বাংলা
বাংলা हिन्दी
 Čeština
 Українська
 Română
FX.co ★ Patterns AUDUSD | Australian Dollar (AUD) to US Dollar (USD) Rate in the Forex market

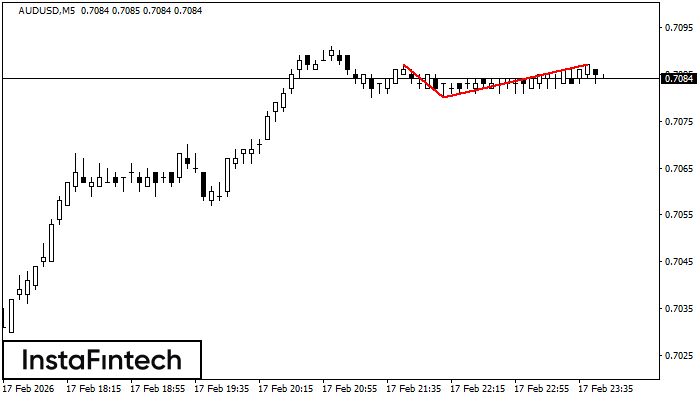
AUDUSD M5
Double Top
The Double Top reversal pattern has been formed on AUDUSD M5. Characteristics: the upper boundary 0.7087; the lower boundary 0.7080; the width of the pattern is 7 points. Sell trades are better to be opened below the lower boundary 0.7080 with a possible movements towards the 0.7065 level.
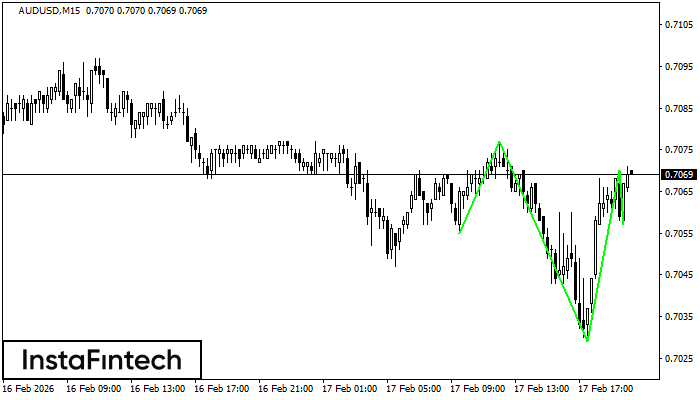
AUDUSD M15
Inverse Head and Shoulder
According to the chart of M15, AUDUSD produced the pattern termed the Inverse Head and Shoulder. The Head is fixed at 0.7029 while the median line of the Neck is set at 0.7077/0.7070. The formation of the Inverse Head and Shoulder Pattern clearly indicates a reversal of the downward trend. In means that in case the scenario comes true, the price of AUDUSD will go towards 0.7092.
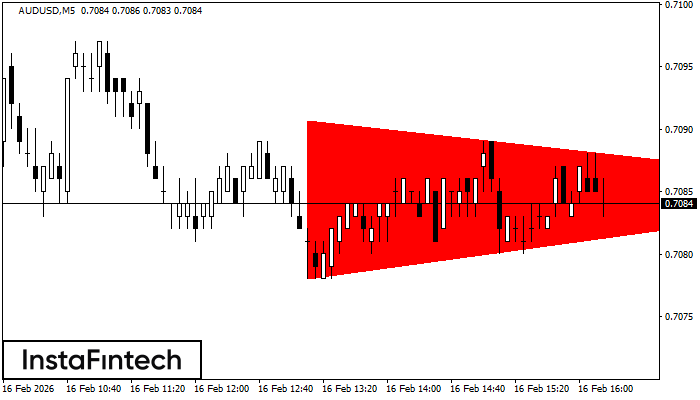
AUDUSD M5
Bearish Symmetrical Triangle
According to the chart of M5, AUDUSD formed the Bearish Symmetrical Triangle pattern. This pattern signals a further downward trend in case the lower border 0.7078 is breached. Here, a hypothetical profit will equal the width of the available pattern that is -13 pips.
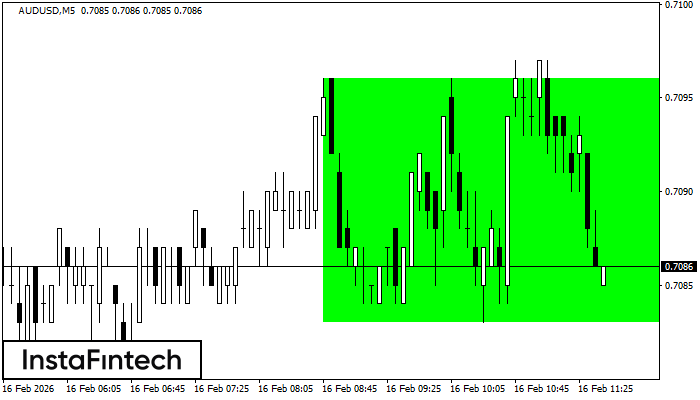
AUDUSD M5
Bullish Rectangle
According to the chart of M5, AUDUSD formed the Bullish Rectangle. The pattern indicates a trend continuation. The upper border is 0.7096, the lower border is 0.7083. The signal means that a long position should be opened above the upper border 0.7096 of the Bullish Rectangle.
AUDUSD M5
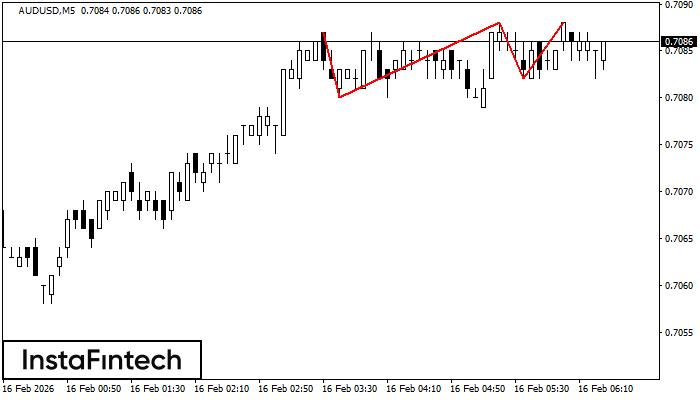
Triple Top
On the chart of the AUDUSD M5 trading instrument, the Triple Top pattern that signals a trend change has formed. It is possible that after formation of the third peak, the price will try to break through the resistance level 0.7080, where we advise to open a trading position for sale. Take profit is the projection of the pattern’s width, which is 7 points.
AUDUSD M30
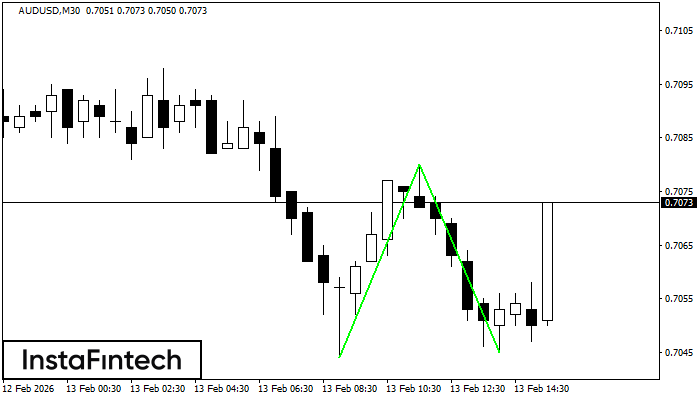
Double Bottom
The Double Bottom pattern has been formed on AUDUSD M30. This formation signals a reversal of the trend from downwards to upwards. The signal is that a buy trade should be opened after the upper boundary of the pattern 0.7080 is broken. The further movements will rely on the width of the current pattern 36 points.
AUDUSD M15
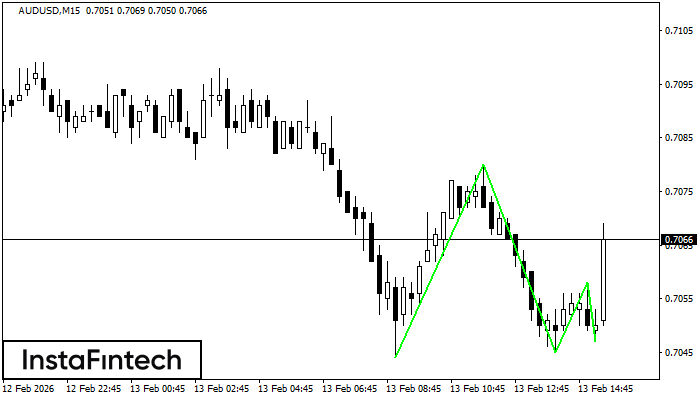
Triple Bottom
The Triple Bottom pattern has formed on the chart of AUDUSD M15. Features of the pattern: The lower line of the pattern has coordinates 0.7080 with the upper limit 0.7080/0.7058, the projection of the width is 36 points. The formation of the Triple Bottom pattern most likely indicates a change in the trend from downward to upward. This means that in the event of a breakdown of the resistance level 0.7044, the price is most likely to continue the upward movement.

AUDUSD M5
Triple Bottom
The Triple Bottom pattern has been formed on AUDUSD M5. It has the following characteristics: resistance level 0.7080/0.7058; support level 0.7044/0.7047; the width is 36 points. In the event of a breakdown of the resistance level of 0.7080, the price is likely to continue an upward movement at least to 0.7060.
AUDUSD M15
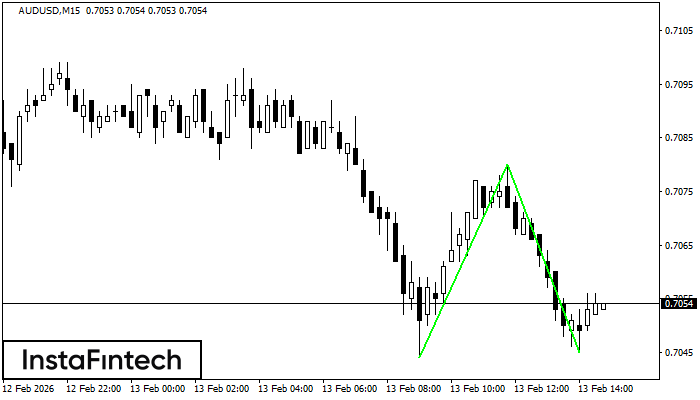
Double Bottom
The Double Bottom pattern has been formed on AUDUSD M15; the upper boundary is 0.7080; the lower boundary is 0.7045. The width of the pattern is 36 points. In case of a break of the upper boundary 0.7080, a change in the trend can be predicted where the width of the pattern will coincide with the distance to a possible take profit level.
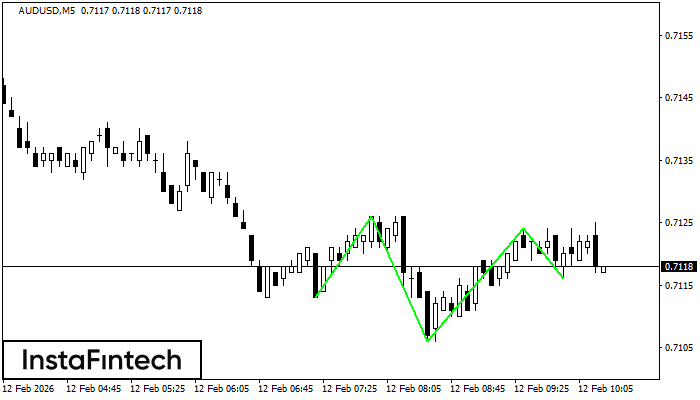
AUDUSD M5
Inverse Head and Shoulder
According to the chart of M5, AUDUSD produced the pattern termed the Inverse Head and Shoulder. The Head is fixed at 0.7106 while the median line of the Neck is set at 0.7126/0.7124. The formation of the Inverse Head and Shoulder Pattern clearly indicates a reversal of the downward trend. In means that in case the scenario comes true, the price of AUDUSD will go towards 0.7139.