 English
  Русский
 Bahasa Indonesia
 Bahasa Malay
 ไทย
ไทย Español
 Deutsch
 Български
 Français
 Tiếng Việt
 中文
中文 বাংলা
বাংলা हिन्दी
 Čeština
 Українська
 Română
FX.co ★ Patterns AUDJPY | Australian Dollar (AUD) to Japanese Yen (JPY) Rate in the Forex market

AUDJPY M5
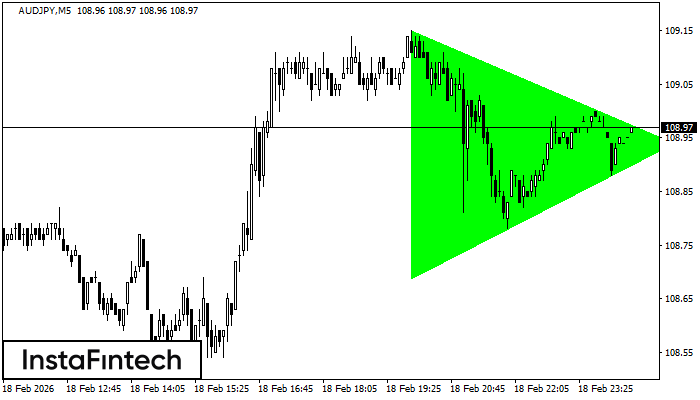
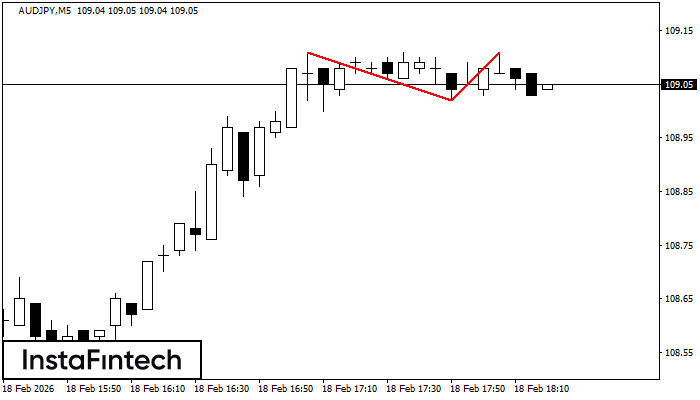
Bullish Symmetrical Triangle
According to the chart of M5, AUDJPY formed the Bullish Symmetrical Triangle pattern. Description: This is the pattern of a trend continuation. 109.15 and 108.69 are the coordinates of the upper and lower borders respectively. The pattern width is measured on the chart at 46 pips. Outlook: If the upper border 109.15 is broken, the price is likely to continue its move by 109.09.
AUDJPY M15
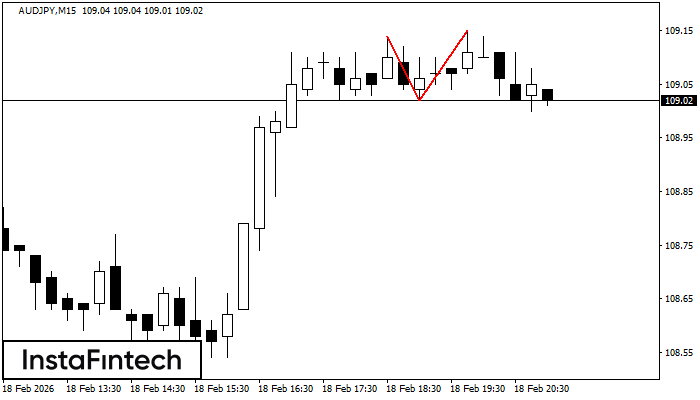
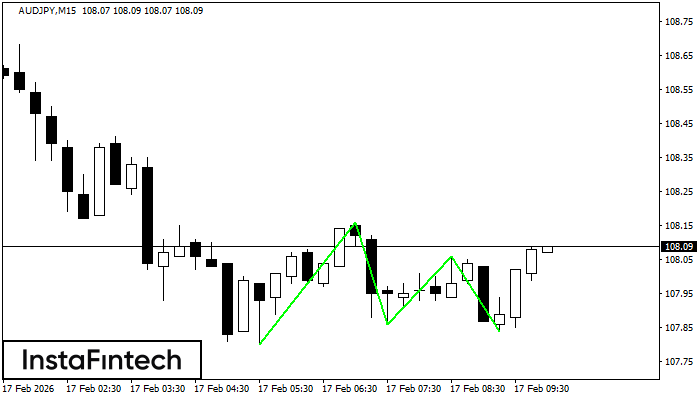
Double Top
The Double Top pattern has been formed on AUDJPY M15. It signals that the trend has been changed from upwards to downwards. Probably, if the base of the pattern 109.02 is broken, the downward movement will continue.
AUDJPY M5
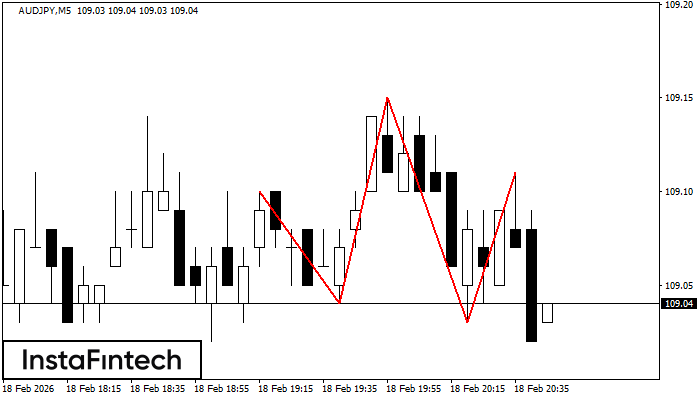
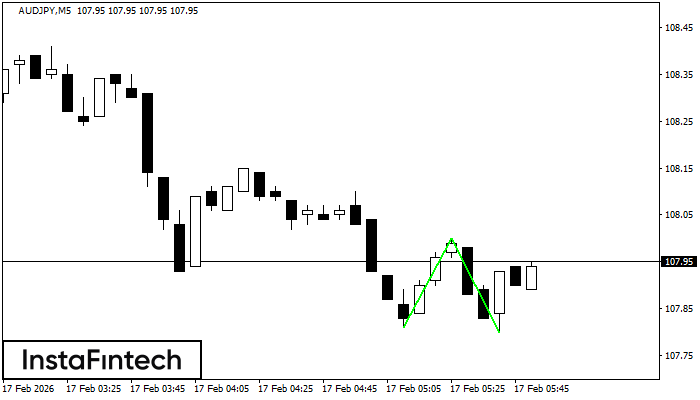
Head and Shoulders
The technical pattern called Head and Shoulders has appeared on the chart of AUDJPY M5. There are weighty reasons to suggest that the price will surpass the Neckline 109.04/109.03 after the right shoulder has been formed. So, the trend is set to change with the price heading for 108.88.
AUDJPY M5
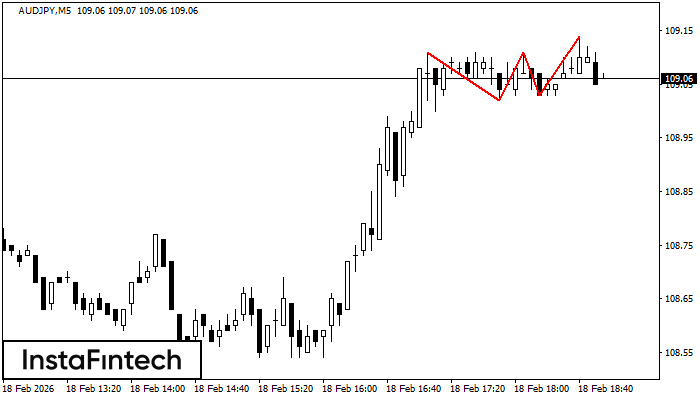
Triple Top
The Triple Top pattern has formed on the chart of the AUDJPY M5. Features of the pattern: borders have an ascending angle; the lower line of the pattern has the coordinates 109.02/109.03 with the upper limit 109.11/109.14; the projection of the width is 9 points. The formation of the Triple Top figure most likely indicates a change in the trend from upward to downward. This means that in the event of a breakdown of the support level of 109.02, the price is most likely to continue the downward movement.
AUDJPY M5
Double Top
The Double Top reversal pattern has been formed on AUDJPY M5. Characteristics: the upper boundary 109.11; the lower boundary 109.02; the width of the pattern is 9 points. Sell trades are better to be opened below the lower boundary 109.02 with a possible movements towards the 108.87 level.
AUDJPY M30
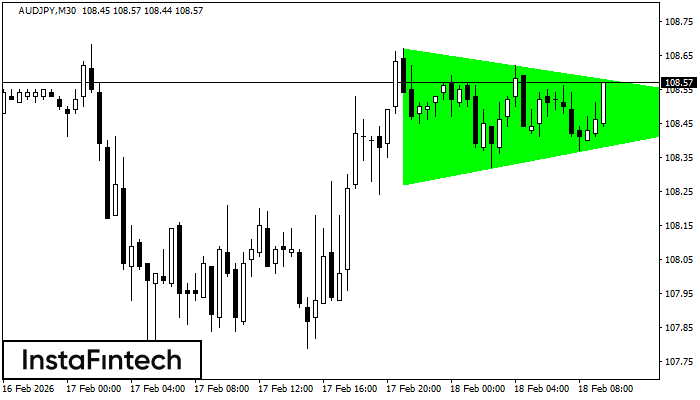
Bullish Symmetrical Triangle
According to the chart of M30, AUDJPY formed the Bullish Symmetrical Triangle pattern. Description: This is the pattern of a trend continuation. 108.67 and 108.27 are the coordinates of the upper and lower borders respectively. The pattern width is measured on the chart at 40 pips. Outlook: If the upper border 108.67 is broken, the price is likely to continue its move by 108.79.
AUDJPY M30
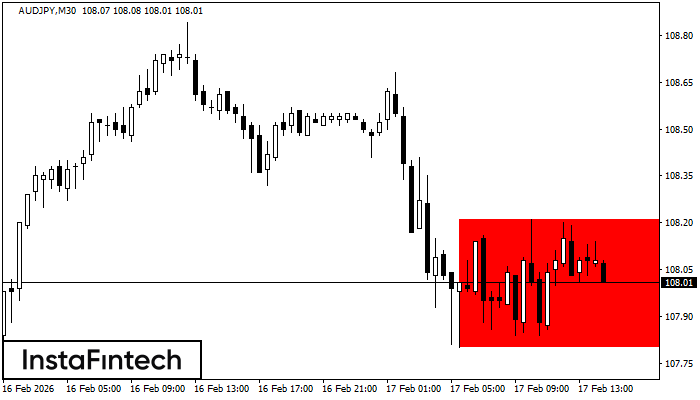
Bearish Rectangle
According to the chart of M30, AUDJPY formed the Bearish Rectangle. The pattern indicates a trend continuation. The upper border is 108.21, the lower border is 107.80. The signal means that a short position should be opened after fixing a price below the lower border 107.80 of the Bearish Rectangle.
AUDJPY M15
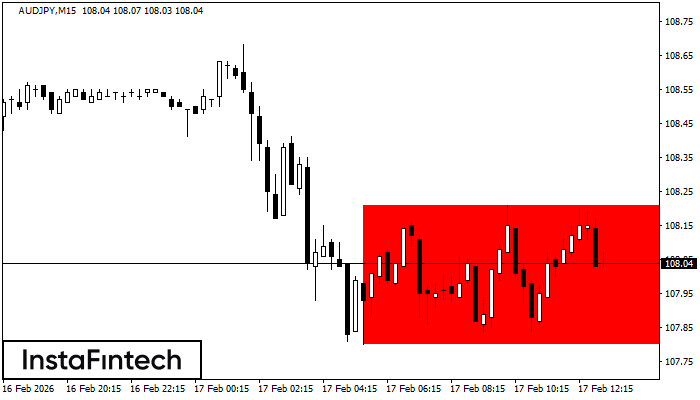
Bearish Rectangle
According to the chart of M15, AUDJPY formed the Bearish Rectangle which is a pattern of a trend continuation. The pattern is contained within the following borders: lower border 107.80 – 107.80 and upper border 108.21 – 108.21. In case the lower border is broken, the instrument is likely to follow the downward trend.
AUDJPY M15
Triple Bottom
The Triple Bottom pattern has been formed on AUDJPY M15. It has the following characteristics: resistance level 108.16/108.06; support level 107.80/107.84; the width is 36 points. In the event of a breakdown of the resistance level of 108.16, the price is likely to continue an upward movement at least to 108.08.
AUDJPY M5
Double Bottom
The Double Bottom pattern has been formed on AUDJPY M5. Characteristics: the support level 107.81; the resistance level 108.00; the width of the pattern 19 points. If the resistance level is broken, a change in the trend can be predicted with the first target point lying at the distance of 20 points.