 English
  Русский
 Bahasa Indonesia
 Bahasa Malay
 ไทย
ไทย Español
 Deutsch
 Български
 Français
 Tiếng Việt
 中文
中文 বাংলা
বাংলা हिन्दी
 Čeština
 Українська
 Română
FX.co ★ Patterns AUDCAD | Australian Dollar (AUD) to Canadian Dollar (CAD) Rate in the Forex market

AUDCAD M15
Double Bottom
The Double Bottom pattern has been formed on AUDCAD M15. Characteristics: the support level 0.9637; the resistance level 0.9681; the width of the pattern 44 points. If the resistance level is broken, a change in the trend can be predicted with the first target point lying at the distance of 45 points.
AUDCAD M5
Triple Top
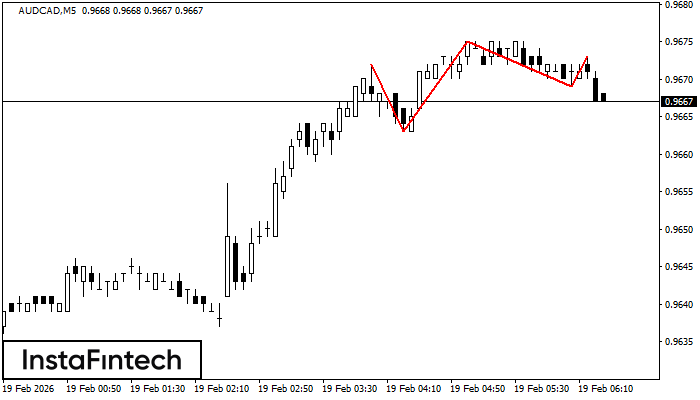
The Triple Top pattern has formed on the chart of the AUDCAD M5. Features of the pattern: borders have an ascending angle; the lower line of the pattern has the coordinates 0.9663/0.9669 with the upper limit 0.9672/0.9673; the projection of the width is 9 points. The formation of the Triple Top figure most likely indicates a change in the trend from upward to downward. This means that in the event of a breakdown of the support level of 0.9663, the price is most likely to continue the downward movement.
AUDCAD M5
Bearish Symmetrical Triangle
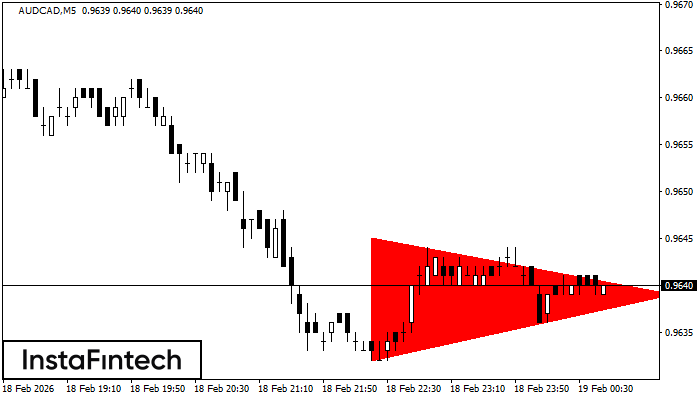
According to the chart of M5, AUDCAD formed the Bearish Symmetrical Triangle pattern. This pattern signals a further downward trend in case the lower border 0.9632 is breached. Here, a hypothetical profit will equal the width of the available pattern that is -13 pips.
AUDCAD M5
Bullish Rectangle
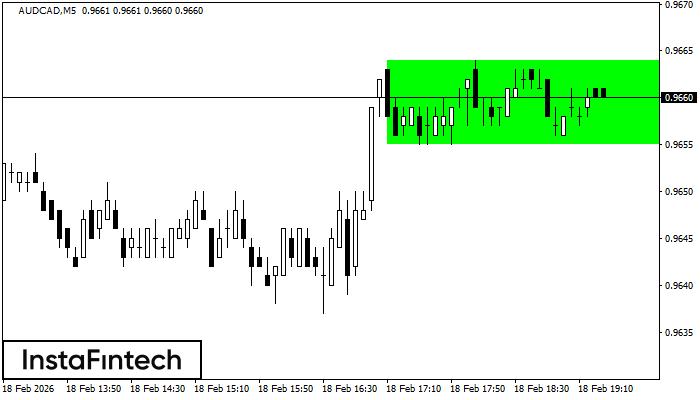
According to the chart of M5, AUDCAD formed the Bullish Rectangle. This type of a pattern indicates a trend continuation. It consists of two levels: resistance 0.9664 and support 0.9655. In case the resistance level 0.9664 - 0.9664 is broken, the instrument is likely to follow the bullish trend.
AUDCAD M5
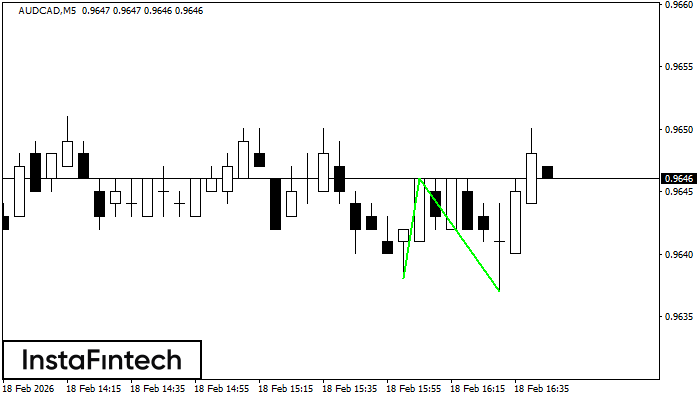
Double Bottom
The Double Bottom pattern has been formed on AUDCAD M5. This formation signals a reversal of the trend from downwards to upwards. The signal is that a buy trade should be opened after the upper boundary of the pattern 0.9646 is broken. The further movements will rely on the width of the current pattern 8 points.
AUDCAD M5
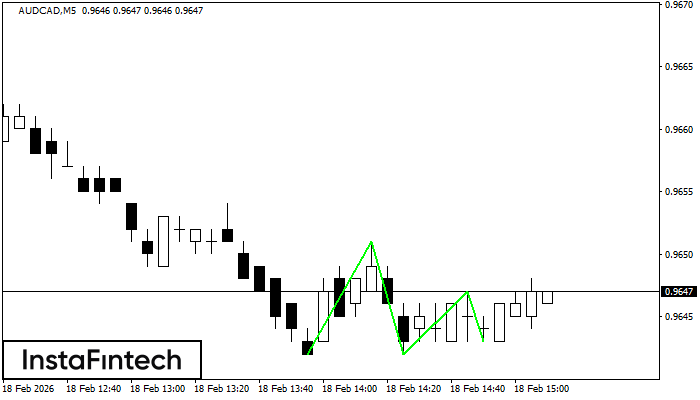
Triple Bottom
The Triple Bottom pattern has formed on the chart of AUDCAD M5. Features of the pattern: The lower line of the pattern has coordinates 0.9651 with the upper limit 0.9651/0.9647, the projection of the width is 9 points. The formation of the Triple Bottom pattern most likely indicates a change in the trend from downward to upward. This means that in the event of a breakdown of the resistance level 0.9642, the price is most likely to continue the upward movement.
AUDCAD M5
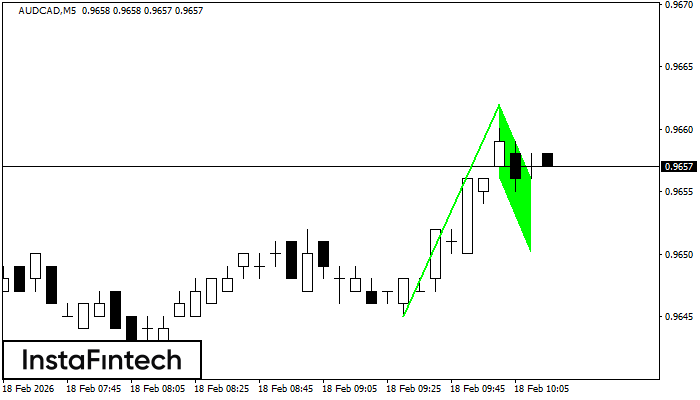
Bullish Flag
The Bullish Flag pattern has been formed on the chart AUDCAD M5 which signals that the upward trend will continue. Signals: а break of the peak at 0.9662 may push the price higher, and the rise will be the projection of the pole.
AUDCAD M5
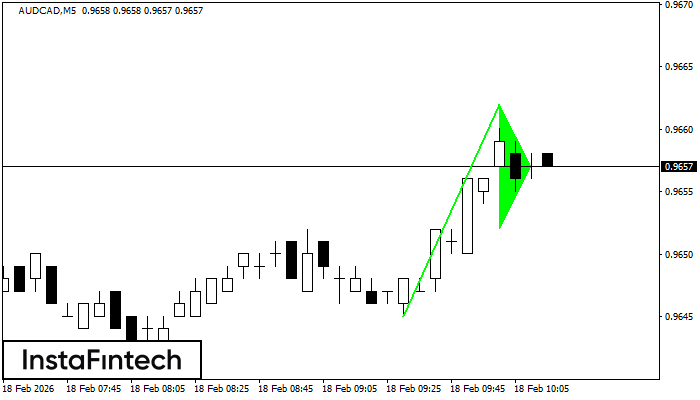
Bullish pennant
The Bullish pennant signal – Trading instrument AUDCAD M5, continuation pattern. Forecast: it is possible to set up a buy position above the pattern’s high of 0.9662, with the prospect of the next move being a projection of the flagpole height.
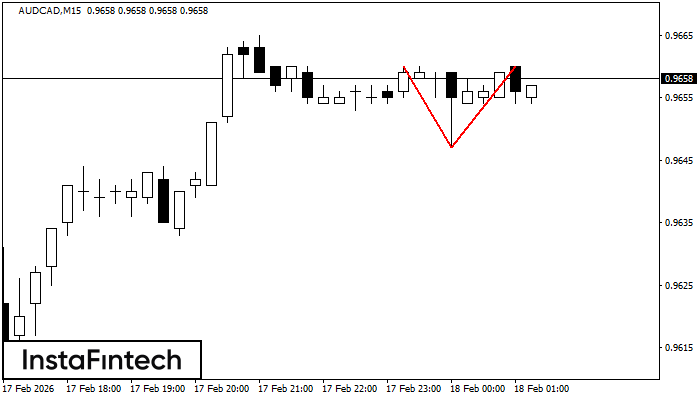
AUDCAD M15
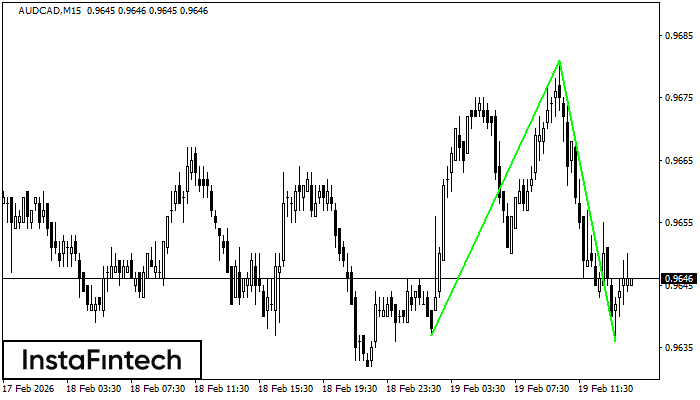
Double Top
The Double Top pattern has been formed on AUDCAD M15. It signals that the trend has been changed from upwards to downwards. Probably, if the base of the pattern 0.9647 is broken, the downward movement will continue.
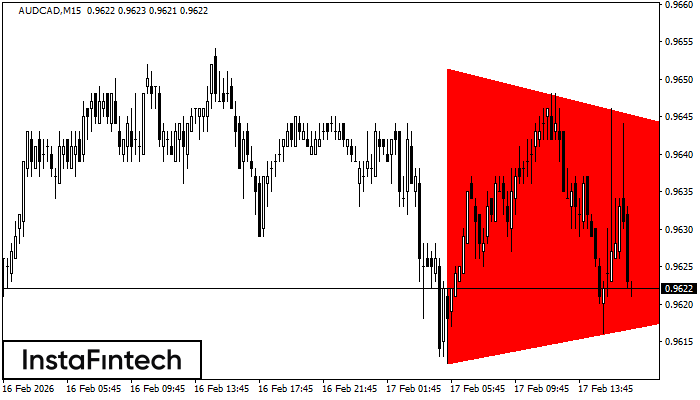
AUDCAD M15
Bearish Symmetrical Triangle
According to the chart of M15, AUDCAD formed the Bearish Symmetrical Triangle pattern. Description: The lower border is 0.9612/0.9629 and upper border is 0.9651/0.9629. The pattern width is measured on the chart at -39 pips. The formation of the Bearish Symmetrical Triangle pattern evidently signals a continuation of the downward trend. In other words, if the scenario comes true and AUDCAD breaches the lower border, the price could continue its move toward 0.9607.