 English
  Русский
 Bahasa Indonesia
 Bahasa Malay
 ไทย
ไทย Español
 Deutsch
 Български
 Français
 Tiếng Việt
 中文
中文 বাংলা
বাংলা हिन्दी
 Čeština
 Українська
 Română
FX.co ★ Patterns #AMZN | Amazon.com, Inc. Stock Price

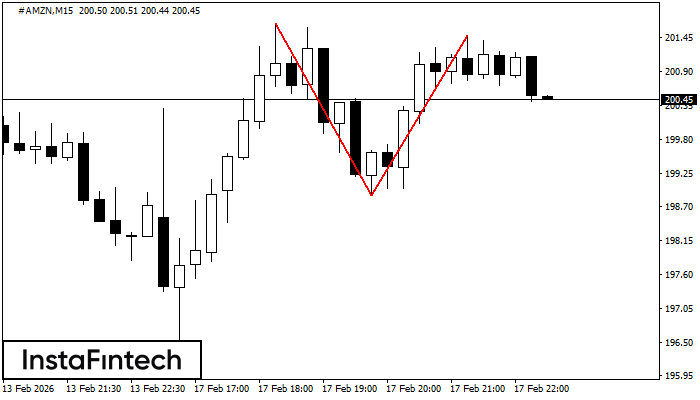
#AMZN M15
Double Top
On the chart of #AMZN M15 the Double Top reversal pattern has been formed. Characteristics: the upper boundary 201.48; the lower boundary 198.88; the width of the pattern 260 points. The signal: a break of the lower boundary will cause continuation of the downward trend targeting the 198.65 level.
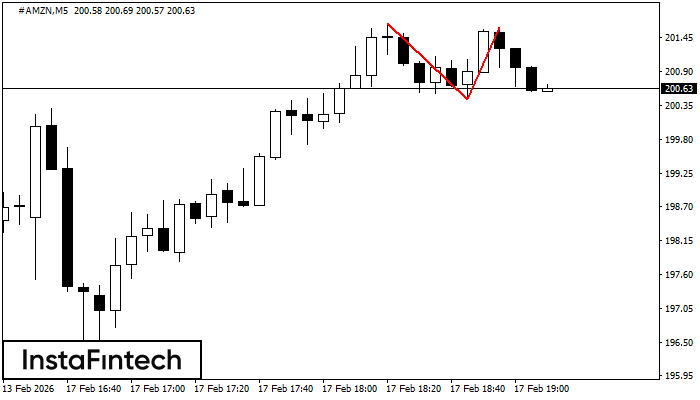
#AMZN M5
Double Top
The Double Top reversal pattern has been formed on #AMZN M5. Characteristics: the upper boundary 201.68; the lower boundary 200.44; the width of the pattern is 118 points. Sell trades are better to be opened below the lower boundary 200.44 with a possible movements towards the 200.29 level.
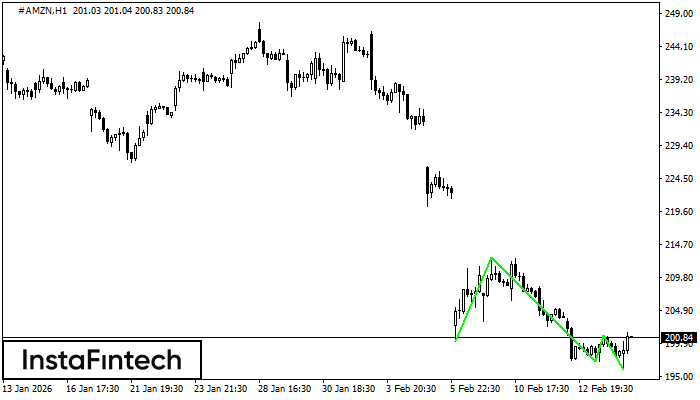
#AMZN H1
Triple Bottom
The Triple Bottom pattern has formed on the chart of the #AMZN H1 trading instrument. The pattern signals a change in the trend from downwards to upwards in the case of breakdown of 212.75/201.11.
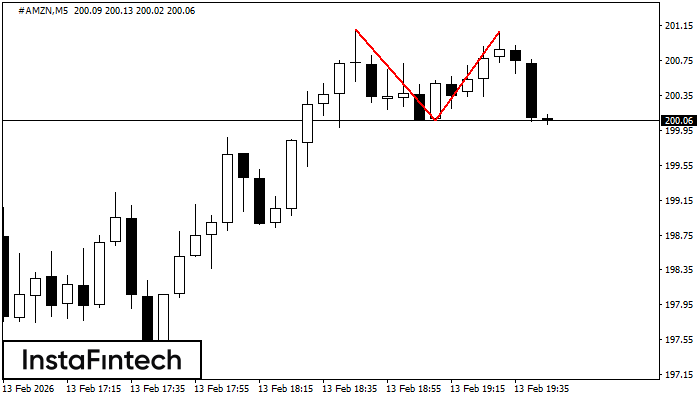
#AMZN M5
Double Top
On the chart of #AMZN M5 the Double Top reversal pattern has been formed. Characteristics: the upper boundary 201.08; the lower boundary 200.06; the width of the pattern 102 points. The signal: a break of the lower boundary will cause continuation of the downward trend targeting the 199.91 level.

#AMZN M30
Bearish pennant
The Bearish pennant pattern has formed on the #AMZN M30 chart. This pattern type is characterized by a slight slowdown after which the price will move in the direction of the original trend. In case the price fixes below the pattern’s low of 197.05, a trader will be able to successfully enter the sell position.
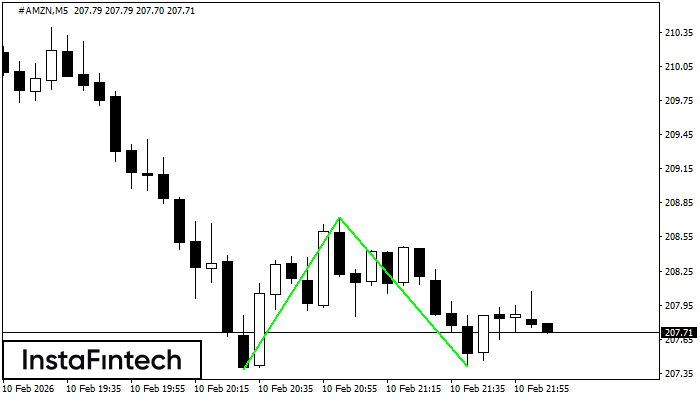
#AMZN M5
Double Bottom
The Double Bottom pattern has been formed on #AMZN M5; the upper boundary is 208.72; the lower boundary is 207.41. The width of the pattern is 134 points. In case of a break of the upper boundary 208.72, a change in the trend can be predicted where the width of the pattern will coincide with the distance to a possible take profit level.
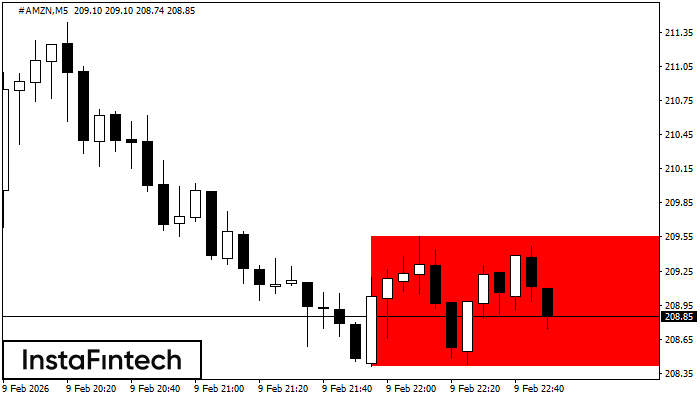
#AMZN M5
Bearish Rectangle
According to the chart of M5, #AMZN formed the Bearish Rectangle which is a pattern of a trend continuation. The pattern is contained within the following borders: lower border 208.41 – 208.41 and upper border 209.55 – 209.55. In case the lower border is broken, the instrument is likely to follow the downward trend.
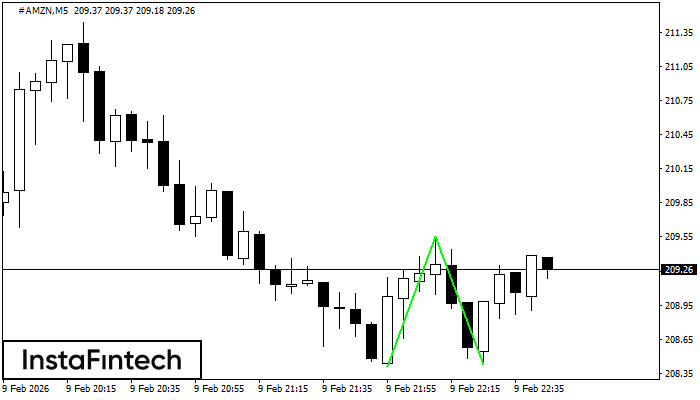
#AMZN M5
Double Bottom
The Double Bottom pattern has been formed on #AMZN M5; the upper boundary is 209.55; the lower boundary is 208.43. The width of the pattern is 114 points. In case of a break of the upper boundary 209.55, a change in the trend can be predicted where the width of the pattern will coincide with the distance to a possible take profit level.
#AMZN M30
Bearish pennant
The Bearish pennant pattern has formed on the #AMZN M30 chart. It signals potential continuation of the existing trend. Specifications: the pattern’s bottom has the coordinate of 200.26; the projection of the flagpole height is equal to 2327 pips. In case the price breaks out the pattern’s bottom of 200.26, the downtrend is expected to continue for further level 199.96.
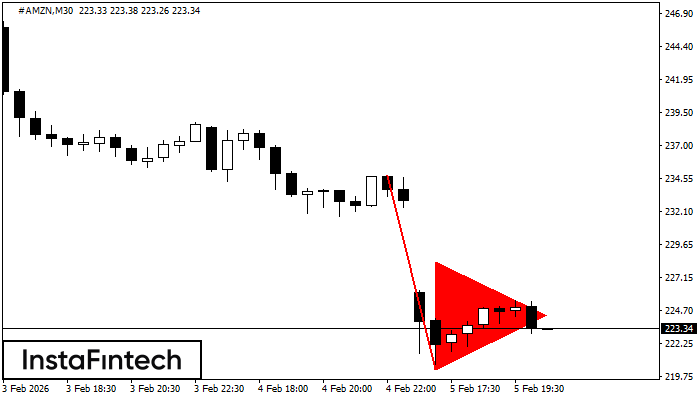
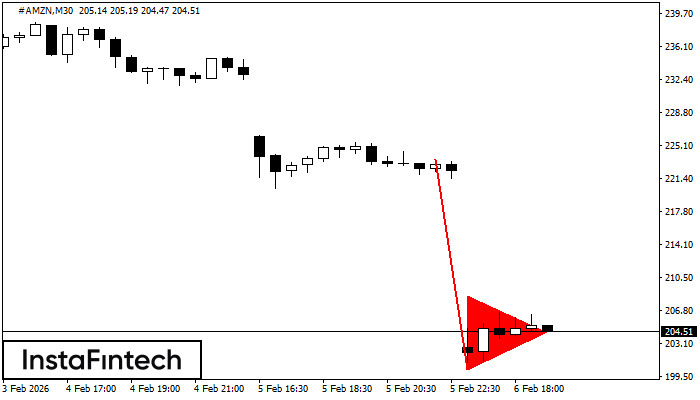
#AMZN M30
Bearish pennant
The Bearish pennant pattern has formed on the #AMZN M30 chart. The pattern signals continuation of the downtrend in case the pennant’s low of 220.33 is broken through. Recommendations: Place the sell stop pending order 10 pips below the pattern’s low. Place the take profit order at the projection distance of the flagpole height.