 中文
中文  Русский
 English
 Bahasa Indonesia
 Bahasa Malay
 ไทย
ไทย Español
 Deutsch
 Български
 Français
 Tiếng Việt
 বাংলা
বাংলা हिन्दी
 Čeština
 Українська
 Română
FX.co ★ Patterns USDCHF | US Dollar (USD) to Swiss Franc (CHF) Rate in the Forex market

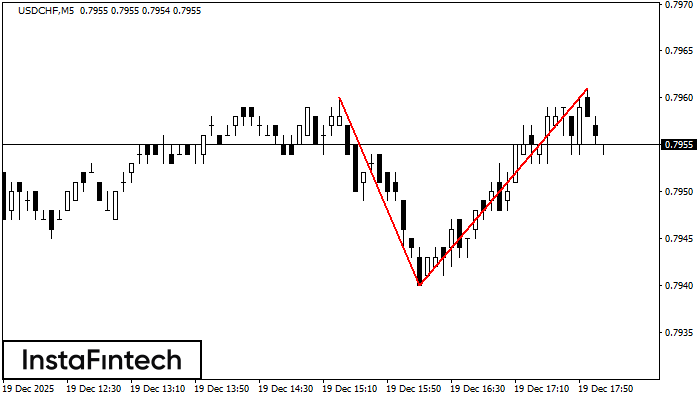
USDCHF M5
Double Top
The Double Top pattern has been formed on USDCHF M5. It signals that the trend has been changed from upwards to downwards. Probably, if the base of the pattern 0.7940 is broken, the downward movement will continue.
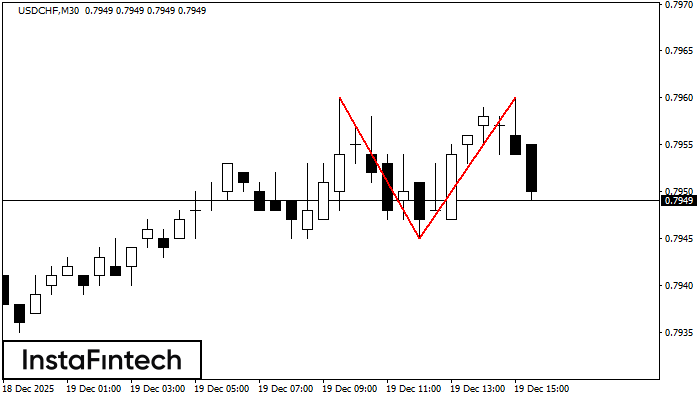
USDCHF M30
Double Top
The Double Top pattern has been formed on USDCHF M30. It signals that the trend has been changed from upwards to downwards. Probably, if the base of the pattern 0.7945 is broken, the downward movement will continue.
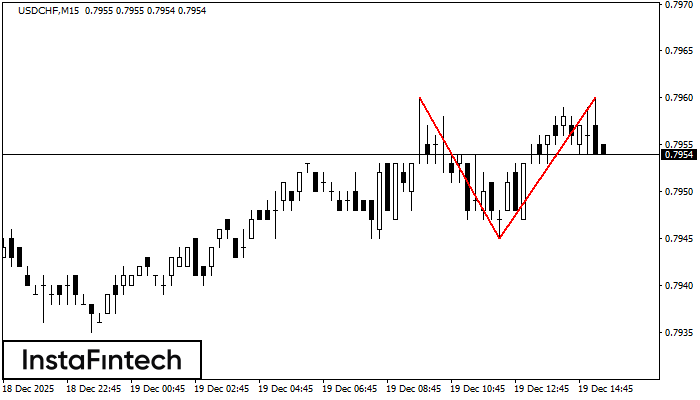
USDCHF M15
Double Top
On the chart of USDCHF M15 the Double Top reversal pattern has been formed. Characteristics: the upper boundary 0.7960; the lower boundary 0.7945; the width of the pattern 15 points. The signal: a break of the lower boundary will cause continuation of the downward trend targeting the 0.7922 level.
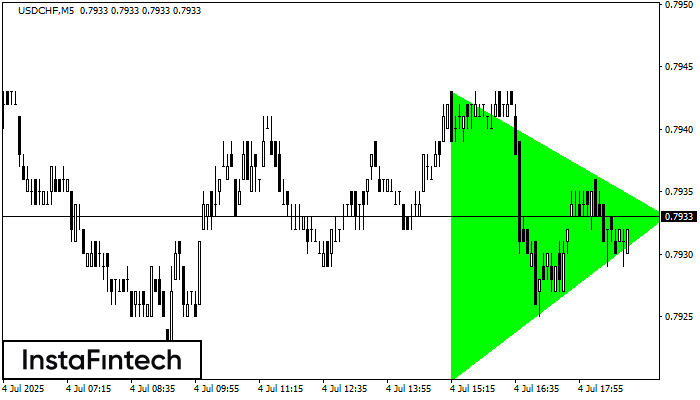
USDCHF M5
Bullish Symmetrical Triangle
According to the chart of M5, USDCHF formed the Bullish Symmetrical Triangle pattern. Description: This is the pattern of a trend continuation. 0.7943 and 0.7920 are the coordinates of the upper and lower borders respectively. The pattern width is measured on the chart at 23 pips. Outlook: If the upper border 0.7943 is broken, the price is likely to continue its move by 0.7948.
USDCHF M5
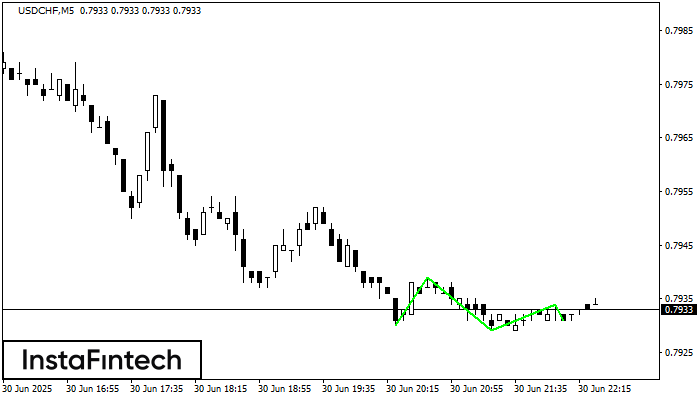
Triple Bottom
The Triple Bottom pattern has formed on the chart of the USDCHF M5 trading instrument. The pattern signals a change in the trend from downwards to upwards in the case of breakdown of 0.7919/0.7918.
USDCHF M5
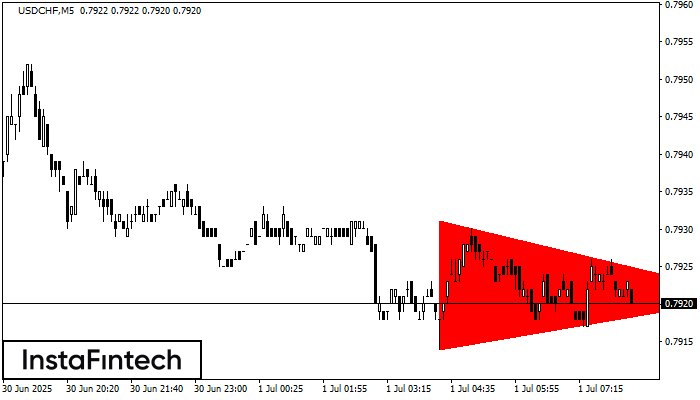
Bearish Symmetrical Triangle
According to the chart of M5, USDCHF formed the Bearish Symmetrical Triangle pattern. Description: The lower border is 0.7914/0.7921 and upper border is 0.7931/0.7921. The pattern width is measured on the chart at -17 pips. The formation of the Bearish Symmetrical Triangle pattern evidently signals a continuation of the downward trend. In other words, if the scenario comes true and USDCHF breaches the lower border, the price could continue its move toward 0.7906.
USDCHF M5
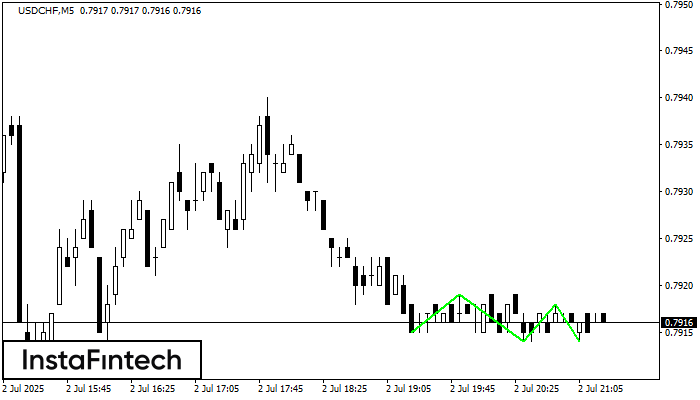
Triple Bottom
The Triple Bottom pattern has formed on the chart of USDCHF M5. Features of the pattern: The lower line of the pattern has coordinates 0.7939 with the upper limit 0.7939/0.7934, the projection of the width is 9 points. The formation of the Triple Bottom pattern most likely indicates a change in the trend from downward to upward. This means that in the event of a breakdown of the resistance level 0.7930, the price is most likely to continue the upward movement.
USDCHF H1
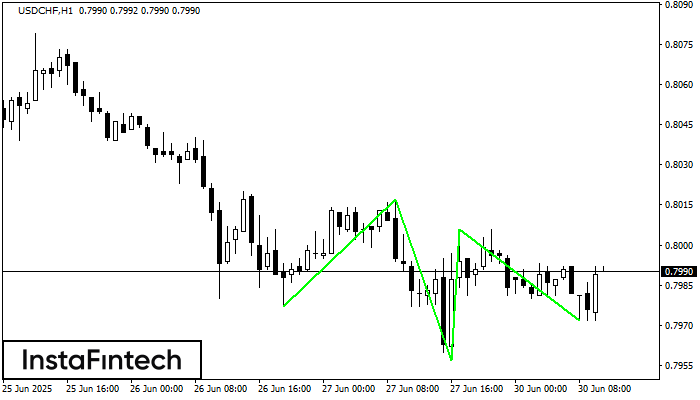
Inverse Head and Shoulder
According to the chart of H1, USDCHF produced the pattern termed the Inverse Head and Shoulder. The Head is fixed at 0.7957 while the median line of the Neck is set at 0.8017/0.8006. The formation of the Inverse Head and Shoulder Pattern clearly indicates a reversal of the downward trend. In means that in case the scenario comes true, the price of USDCHF will go towards 0.8046.
USDCHF M5
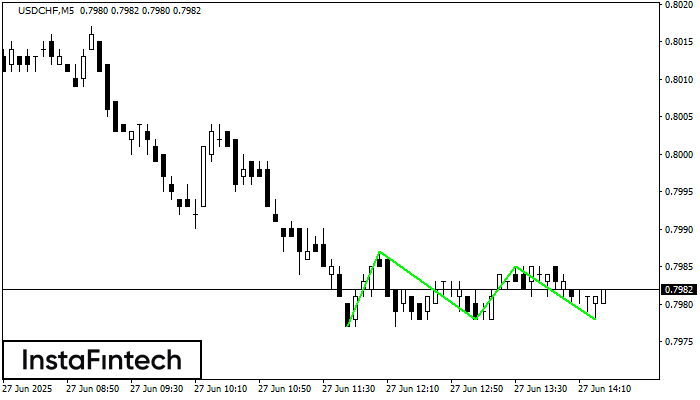
Double Bottom
The Double Bottom pattern has been formed on USDCHF M5. This formation signals a reversal of the trend from downwards to upwards. The signal is that a buy trade should be opened after the upper boundary of the pattern 0.7986 is broken. The further movements will rely on the width of the current pattern 14 points.
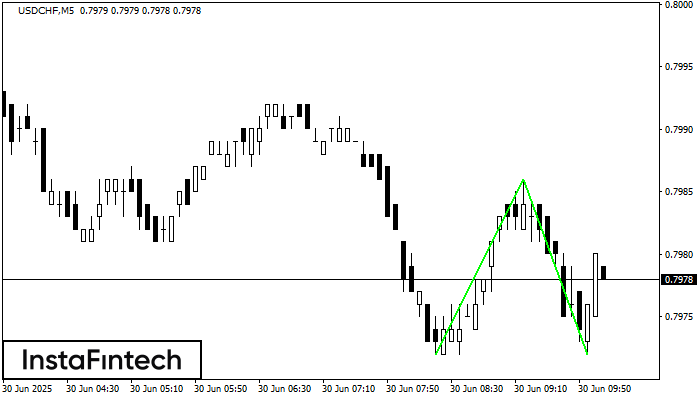
USDCHF M5
Triple Bottom
The Triple Bottom pattern has formed on the chart of the USDCHF M5 trading instrument. The pattern signals a change in the trend from downwards to upwards in the case of breakdown of 0.7987/0.7985.