 中文
中文  Русский
 English
 Bahasa Indonesia
 Bahasa Malay
 ไทย
ไทย Español
 Deutsch
 Български
 Français
 Tiếng Việt
 বাংলা
বাংলা हिन्दी
 Čeština
 Українська
 Română
FX.co ★ Patterns USDCAD | US Dollar (USD) to the Canadian Dollar (CAD) Rate in the Forex market

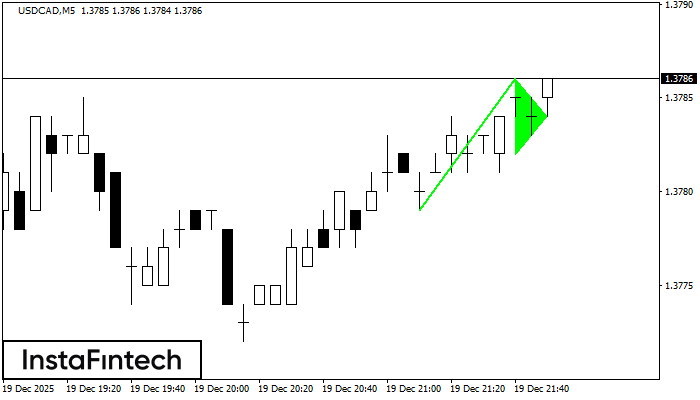
USDCAD M5
Bullish pennant
The Bullish pennant graphic pattern has formed on the USDCAD M5 instrument. This pattern type falls under the category of continuation patterns. In this case, if the quote can breaks out high, is expected to continue the upward trend to level 1.3801.
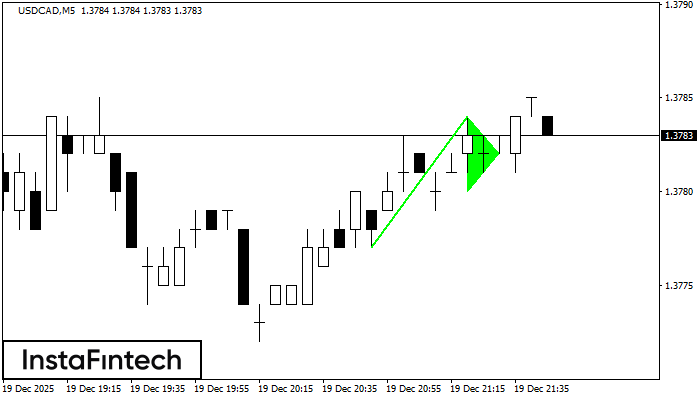
USDCAD M5
Bullish pennant
The Bullish pennant signal – Trading instrument USDCAD M5, continuation pattern. Forecast: it is possible to set up a buy position above the pattern’s high of 1.3784, with the prospect of the next move being a projection of the flagpole height.
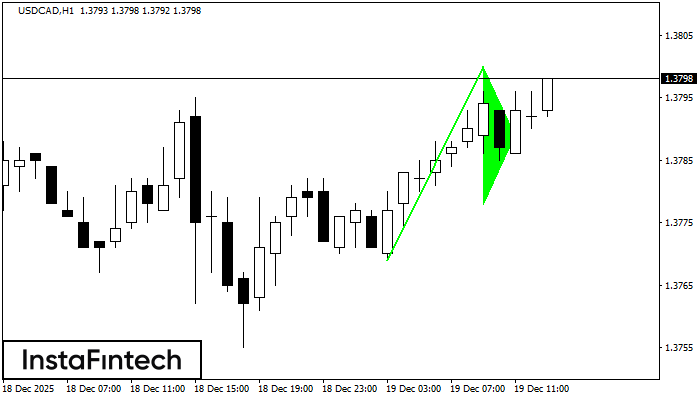
USDCAD H1
Bullish pennant
The Bullish pennant pattern is formed on the USDCAD H1 chart. It is a type of the continuation pattern. Supposedly, in case the price is fixed above the pennant’s high of 1.3800, a further uptrend is possible.
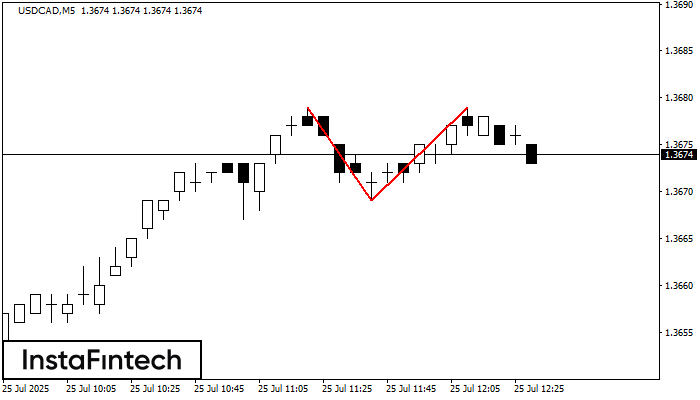
USDCAD M5
Double Top
The Double Top reversal pattern has been formed on USDCAD M5. Characteristics: the upper boundary 1.3679; the lower boundary 1.3669; the width of the pattern is 10 points. Sell trades are better to be opened below the lower boundary 1.3669 with a possible movements towards the 1.3654 level.
USDCAD D1
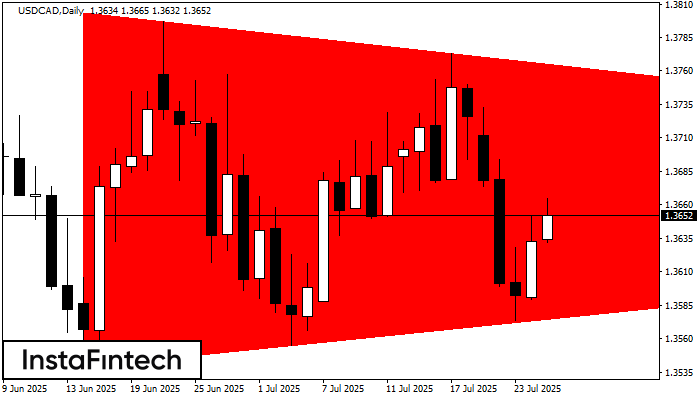
Bearish Symmetrical Triangle
According to the chart of D1, USDCAD formed the Bearish Symmetrical Triangle pattern. Description: The lower border is 1.3539/1.3666 and upper border is 1.3804/1.3666. The pattern width is measured on the chart at -265 pips. The formation of the Bearish Symmetrical Triangle pattern evidently signals a continuation of the downward trend. In other words, if the scenario comes true and USDCAD breaches the lower border, the price could continue its move toward 1.3626.
USDCAD M5
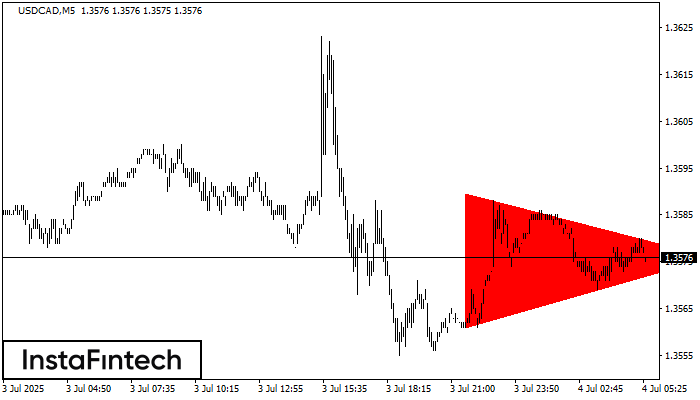
Bearish Symmetrical Triangle
According to the chart of M5, USDCAD formed the Bearish Symmetrical Triangle pattern. Description: The lower border is 1.3561/1.3576 and upper border is 1.3590/1.3576. The pattern width is measured on the chart at -29 pips. The formation of the Bearish Symmetrical Triangle pattern evidently signals a continuation of the downward trend. In other words, if the scenario comes true and USDCAD breaches the lower border, the price could continue its move toward 1.3561.
USDCAD M5
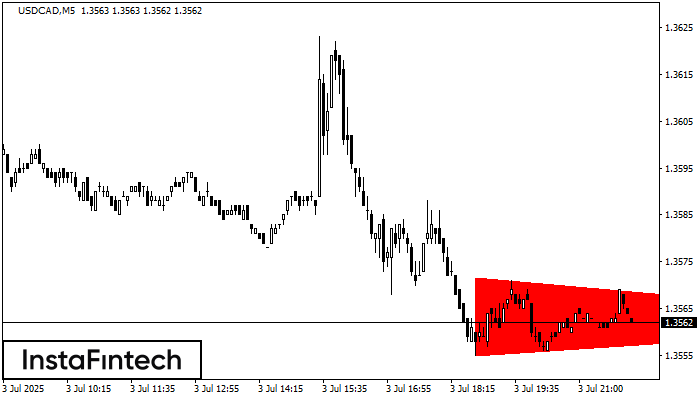
Bearish Symmetrical Triangle
According to the chart of M5, USDCAD formed the Bearish Symmetrical Triangle pattern. Trading recommendations: A breach of the lower border 1.3555 is likely to encourage a continuation of the downward trend.
USDCAD M5
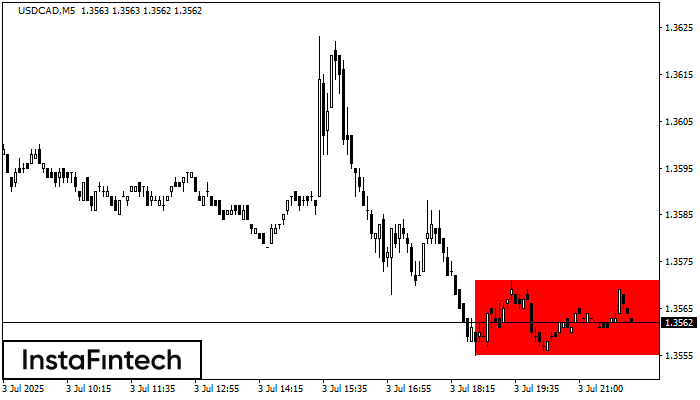
Bearish Rectangle
According to the chart of M5, USDCAD formed the Bearish Rectangle which is a pattern of a trend continuation. The pattern is contained within the following borders: lower border 1.3555 – 1.3555 and upper border 1.3571 – 1.3571. In case the lower border is broken, the instrument is likely to follow the downward trend.
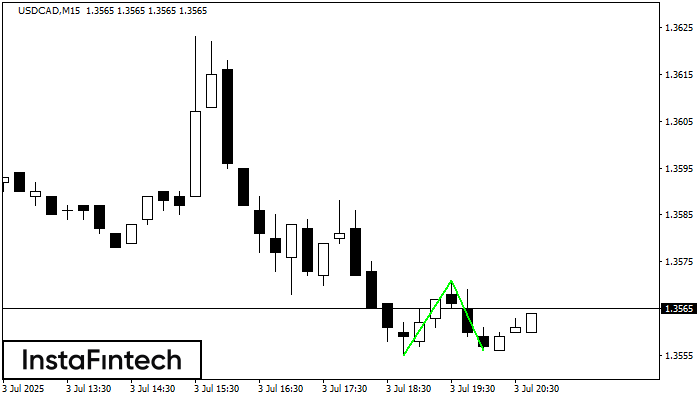
USDCAD M15
Double Bottom
The Double Bottom pattern has been formed on USDCAD M15. Characteristics: the support level 1.3555; the resistance level 1.3571; the width of the pattern 16 points. If the resistance level is broken, a change in the trend can be predicted with the first target point lying at the distance of 15 points.
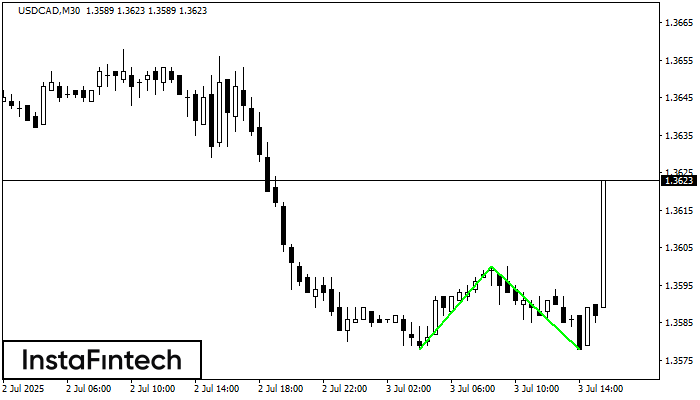
USDCAD M30
Double Bottom
The Double Bottom pattern has been formed on USDCAD M30. Characteristics: the support level 1.3578; the resistance level 1.3600; the width of the pattern 22 points. If the resistance level is broken, a change in the trend can be predicted with the first target point lying at the distance of 22 points.