 中文
中文  Русский
 English
 Bahasa Indonesia
 Bahasa Malay
 ไทย
ไทย Español
 Deutsch
 Български
 Français
 Tiếng Việt
 বাংলা
বাংলা हिन्दी
 Čeština
 Українська
 Română
FX.co ★ Patterns #MSFT | Microsoft Corporation Stock Price

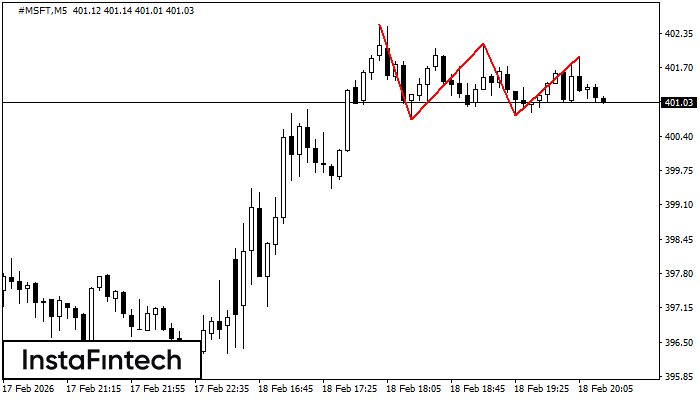
#MSFT M5
Triple Top
The Triple Top pattern has formed on the chart of the #MSFT M5. Features of the pattern: borders have an ascending angle; the lower line of the pattern has the coordinates 400.72/400.78 with the upper limit 402.52/401.90; the projection of the width is 180 points. The formation of the Triple Top figure most likely indicates a change in the trend from upward to downward. This means that in the event of a breakdown of the support level of 400.72, the price is most likely to continue the downward movement.
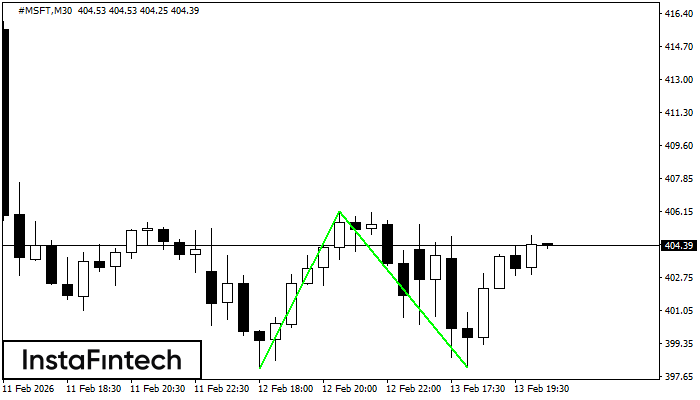
#MSFT M30
Double Bottom
The Double Bottom pattern has been formed on #MSFT M30. Characteristics: the support level 398.02; the resistance level 406.19; the width of the pattern 817 points. If the resistance level is broken, a change in the trend can be predicted with the first target point lying at the distance of 811 points.
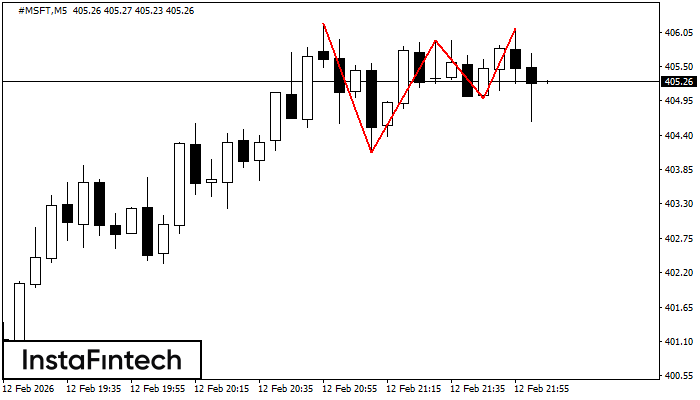
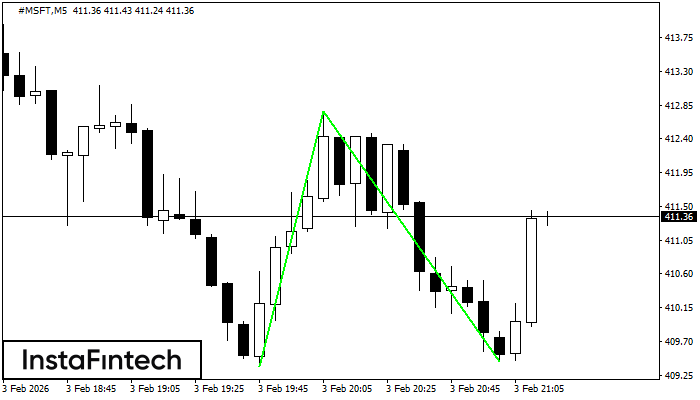
#MSFT M5
Triple Top
The Triple Top pattern has formed on the chart of the #MSFT M5 trading instrument. It is a reversal pattern featuring the following characteristics: resistance level 8, support level -86, and pattern’s width 207. Forecast If the price breaks through the support level 404.12, it is likely to move further down to 405.76.
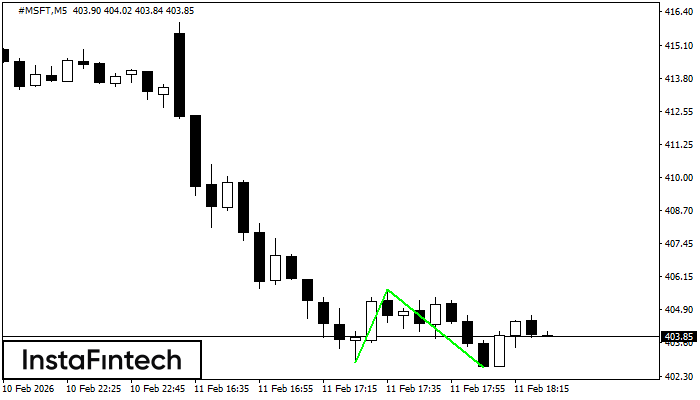
#MSFT M5
Double Bottom
The Double Bottom pattern has been formed on #MSFT M5. Characteristics: the support level 402.84; the resistance level 405.66; the width of the pattern 282 points. If the resistance level is broken, a change in the trend can be predicted with the first target point lying at the distance of 303 points.
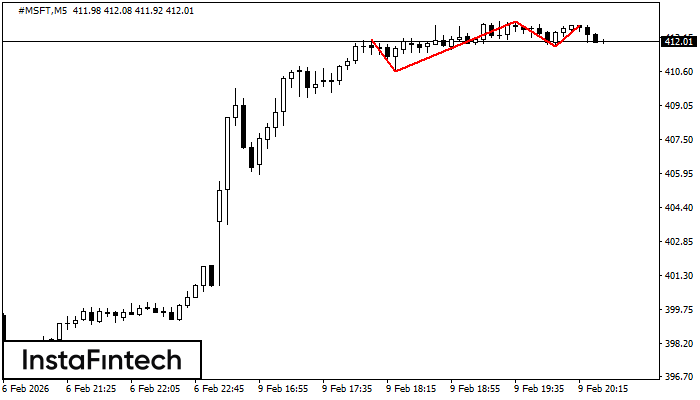
#MSFT M5
Triple Top
On the chart of the #MSFT M5 trading instrument, the Triple Top pattern that signals a trend change has formed. It is possible that after formation of the third peak, the price will try to break through the resistance level 410.63, where we advise to open a trading position for sale. Take profit is the projection of the pattern’s width, which is 143 points.
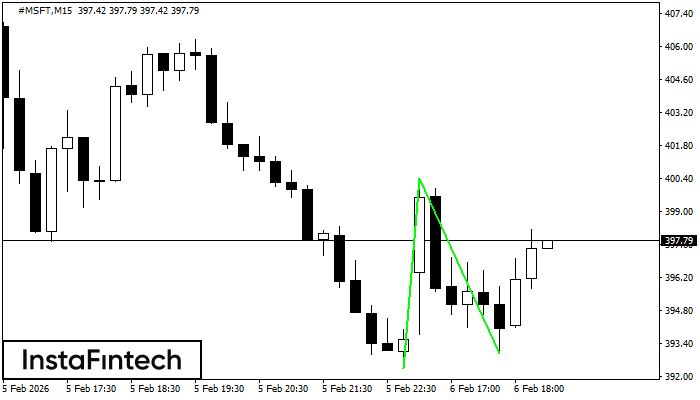
#MSFT M15
Double Bottom
The Double Bottom pattern has been formed on #MSFT M15. This formation signals a reversal of the trend from downwards to upwards. The signal is that a buy trade should be opened after the upper boundary of the pattern 400.41 is broken. The further movements will rely on the width of the current pattern 807 points.
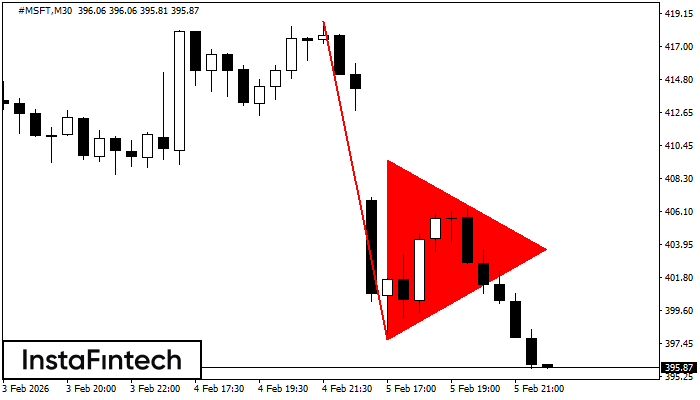
#MSFT M30
Bearish pennant
The Bearish pennant pattern has formed on the #MSFT M30 chart. This pattern type is characterized by a slight slowdown after which the price will move in the direction of the original trend. In case the price fixes below the pattern’s low of 397.71, a trader will be able to successfully enter the sell position.
#MSFT M5
Double Bottom
The Double Bottom pattern has been formed on #MSFT M5; the upper boundary is 412.77; the lower boundary is 409.43. The width of the pattern is 340 points. In case of a break of the upper boundary 412.77, a change in the trend can be predicted where the width of the pattern will coincide with the distance to a possible take profit level.
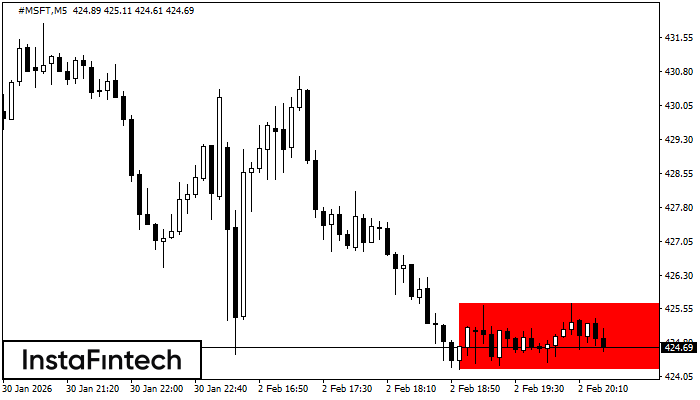
#MSFT M5
Bearish Rectangle
According to the chart of M5, #MSFT formed the Bearish Rectangle which is a pattern of a trend continuation. The pattern is contained within the following borders: lower border 424.20 – 424.20 and upper border 425.68 – 425.68. In case the lower border is broken, the instrument is likely to follow the downward trend.
#MSFT M5
Triple Bottom
The Triple Bottom pattern has formed on the chart of the #MSFT M5 trading instrument. The pattern signals a change in the trend from downwards to upwards in the case of breakdown of 432.63/432.61.