 中文
中文  Русский
 English
 Bahasa Indonesia
 Bahasa Malay
 ไทย
ไทย Español
 Deutsch
 Български
 Français
 Tiếng Việt
 বাংলা
বাংলা हिन्दी
 Čeština
 Українська
 Română
FX.co ★ Patterns #MA | Mastercard IncorpoRated Stock Price

#MA M15
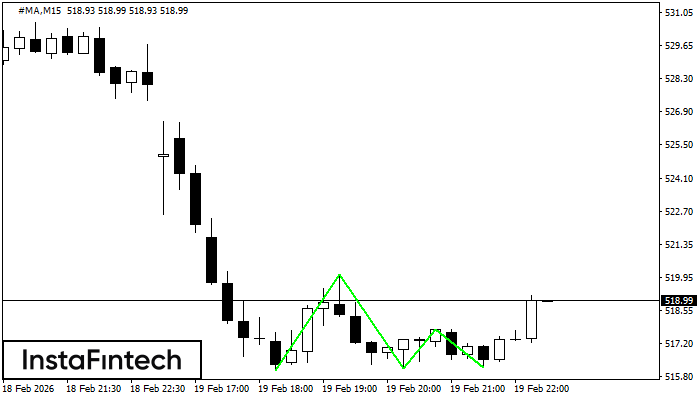
Triple Bottom
The Triple Bottom pattern has been formed on #MA M15. It has the following characteristics: resistance level 520.07/517.77; support level 516.07/516.20; the width is 400 points. In the event of a breakdown of the resistance level of 520.07, the price is likely to continue an upward movement at least to 516.39.
#MA M15
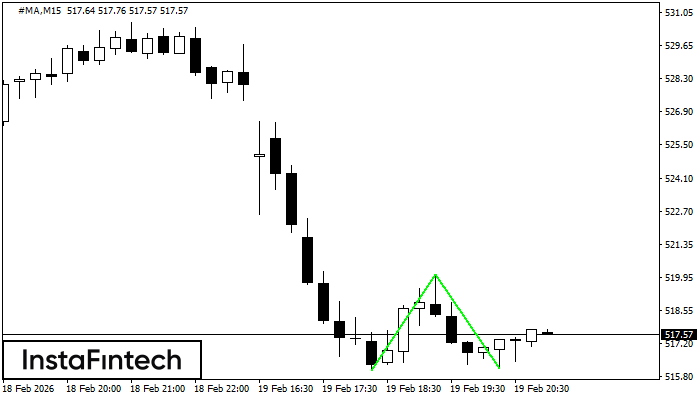
Double Bottom
The Double Bottom pattern has been formed on #MA M15; the upper boundary is 520.07; the lower boundary is 516.16. The width of the pattern is 400 points. In case of a break of the upper boundary 520.07, a change in the trend can be predicted where the width of the pattern will coincide with the distance to a possible take profit level.
#MA M5
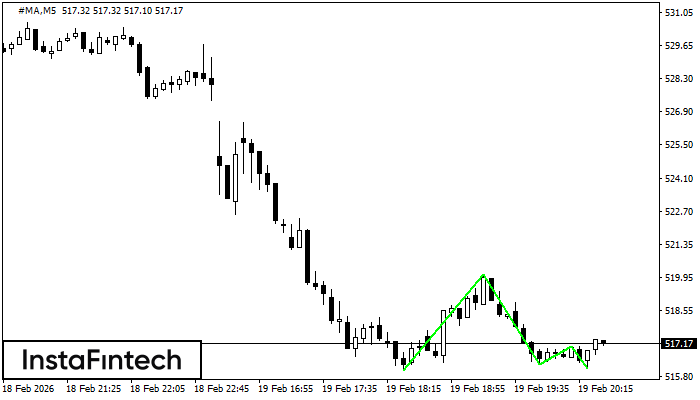
Triple Bottom
The Triple Bottom pattern has formed on the chart of #MA M5. Features of the pattern: The lower line of the pattern has coordinates 520.07 with the upper limit 520.07/517.08, the projection of the width is 400 points. The formation of the Triple Bottom pattern most likely indicates a change in the trend from downward to upward. This means that in the event of a breakdown of the resistance level 516.07, the price is most likely to continue the upward movement.
#MA M5
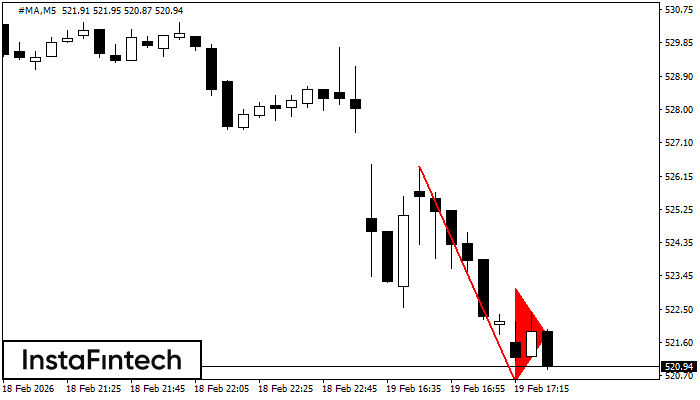
Bearish pennant
The Bearish pennant pattern has formed on the #MA M5 chart. The pattern signals continuation of the downtrend in case the pennant’s low of 520.50 is broken through. Recommendations: Place the sell stop pending order 10 pips below the pattern’s low. Place the take profit order at the projection distance of the flagpole height.
#MA M5
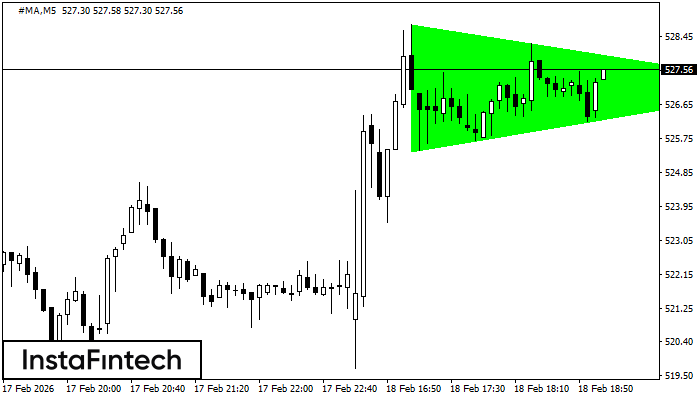
Bullish Symmetrical Triangle
According to the chart of M5, #MA formed the Bullish Symmetrical Triangle pattern, which signals the trend will continue. Description. The upper border of the pattern touches the coordinates 528.77/527.13 whereas the lower border goes across 525.40/527.13. The pattern width is measured on the chart at 337 pips. If the Bullish Symmetrical Triangle pattern is in progress during the upward trend, this indicates the current trend will go on. In case 527.13 is broken, the price could continue its move toward 527.28.
#MA M5
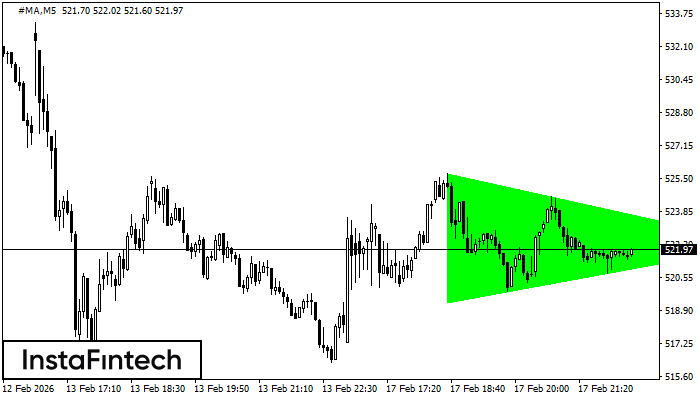
Bullish Symmetrical Triangle
According to the chart of M5, #MA formed the Bullish Symmetrical Triangle pattern, which signals the trend will continue. Description. The upper border of the pattern touches the coordinates 525.73/522.20 whereas the lower border goes across 519.32/522.20. The pattern width is measured on the chart at 641 pips. If the Bullish Symmetrical Triangle pattern is in progress during the upward trend, this indicates the current trend will go on. In case 522.20 is broken, the price could continue its move toward 522.35.
#MA M15
Double Bottom
The Double Bottom pattern has been formed on #MA M15. Characteristics: the support level 516.03; the resistance level 525.61; the width of the pattern 958 points. If the resistance level is broken, a change in the trend can be predicted with the first target point lying at the distance of 927 points.
#MA M5
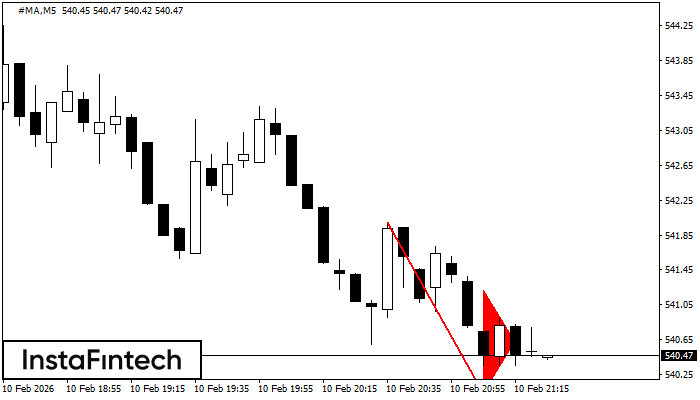
Bearish pennant
The Bearish pennant pattern has formed on the #MA M5 chart. This pattern type is characterized by a slight slowdown after which the price will move in the direction of the original trend. In case the price fixes below the pattern’s low of 540.03, a trader will be able to successfully enter the sell position.
#MA M15
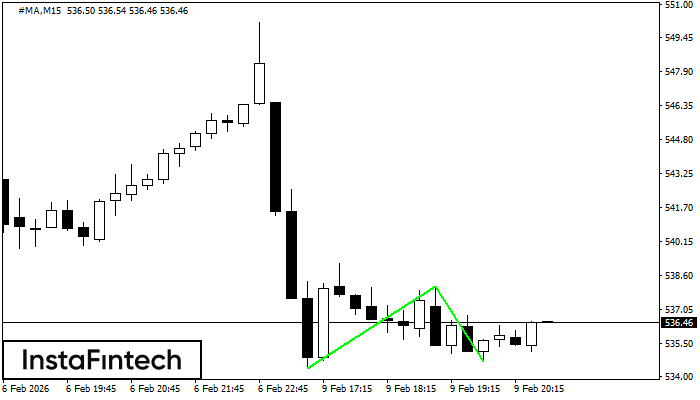
Double Bottom
The Double Bottom pattern has been formed on #MA M15. This formation signals a reversal of the trend from downwards to upwards. The signal is that a buy trade should be opened after the upper boundary of the pattern 538.14 is broken. The further movements will rely on the width of the current pattern 375 points.
#MA M15
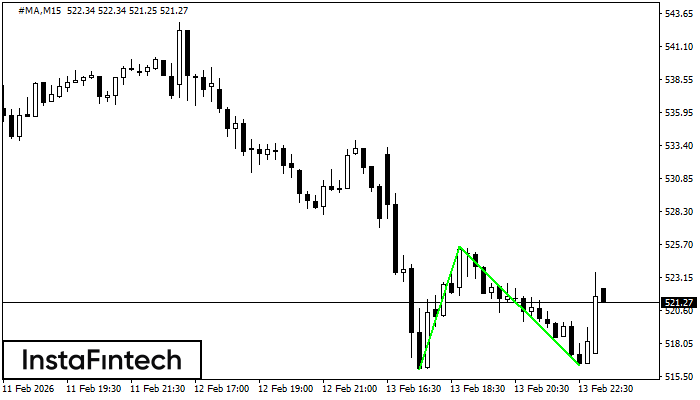
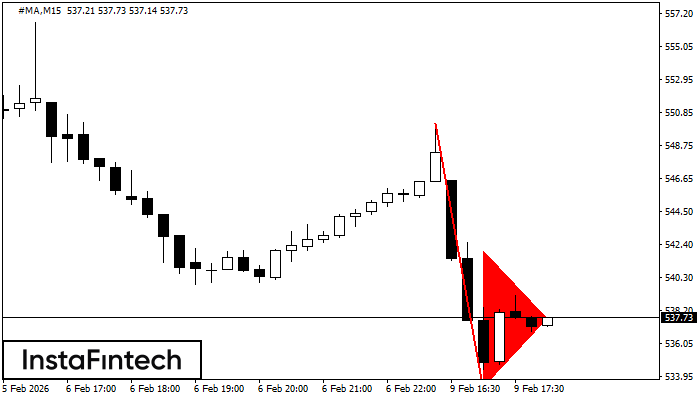
Bearish pennant
The Bearish pennant pattern has formed on the #MA M15 chart. This pattern type is characterized by a slight slowdown after which the price will move in the direction of the original trend. In case the price fixes below the pattern’s low of 533.28, a trader will be able to successfully enter the sell position.