 中文
中文  Русский
 English
 Bahasa Indonesia
 Bahasa Malay
 ไทย
ไทย Español
 Deutsch
 Български
 Français
 Tiếng Việt
 বাংলা
বাংলা हिन्दी
 Čeština
 Українська
 Română
FX.co ★ Patterns #KO | The Coca-Cola Company Stock Price

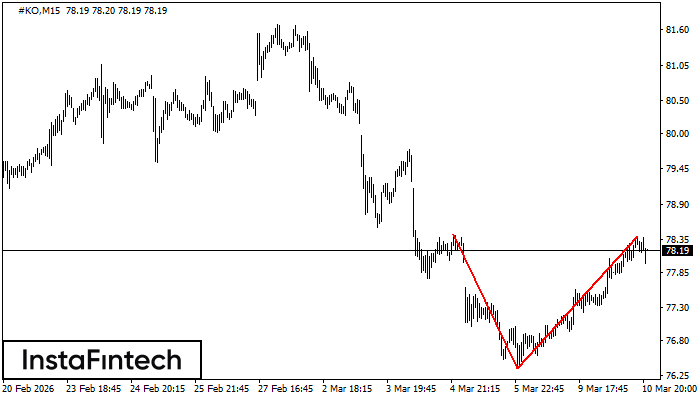
#KO M15
Double Top
The Double Top reversal pattern has been formed on #KO M15. Characteristics: the upper boundary 78.43; the lower boundary 76.36; the width of the pattern is 204 points. Sell trades are better to be opened below the lower boundary 76.36 with a possible movements towards the 76.14 level.
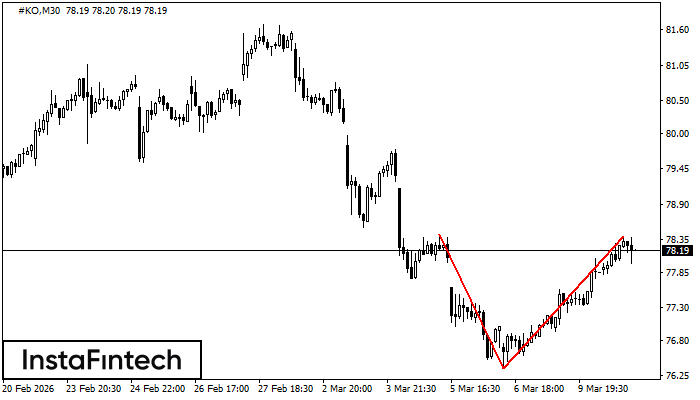
#KO M30
Double Top
The Double Top reversal pattern has been formed on #KO M30. Characteristics: the upper boundary 78.43; the lower boundary 76.36; the width of the pattern is 204 points. Sell trades are better to be opened below the lower boundary 76.36 with a possible movements towards the 76.06 level.
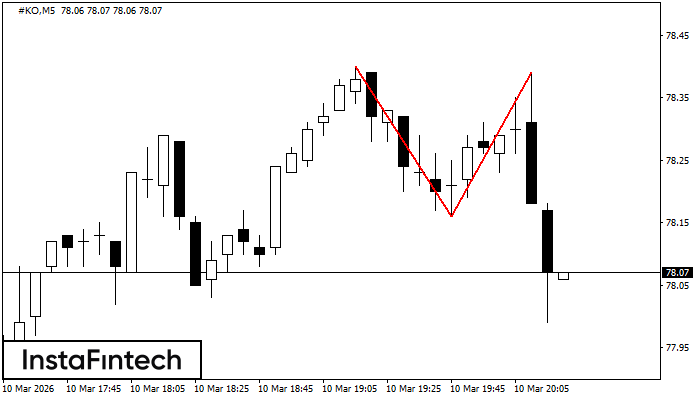
#KO M5
Double Top
The Double Top pattern has been formed on #KO M5. It signals that the trend has been changed from upwards to downwards. Probably, if the base of the pattern 78.16 is broken, the downward movement will continue.
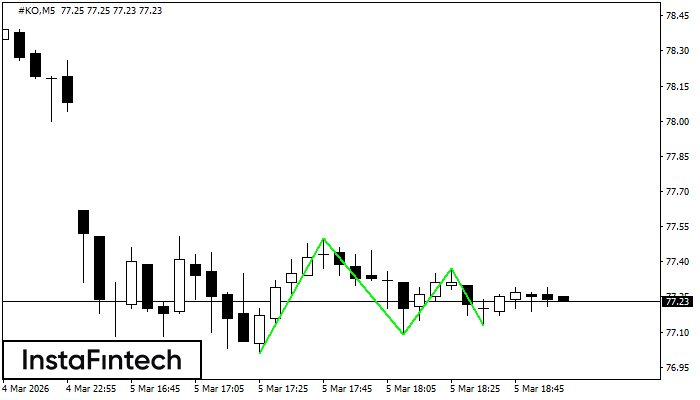
#KO M5
Triple Bottom
The Triple Bottom pattern has formed on the chart of the #KO M5 trading instrument. The pattern signals a change in the trend from downwards to upwards in the case of breakdown of 77.50/77.37.
#KO M5
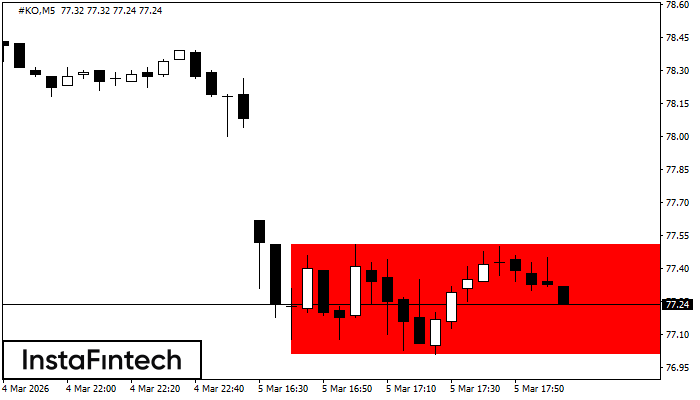
Bearish Rectangle
According to the chart of M5, #KO formed the Bearish Rectangle which is a pattern of a trend continuation. The pattern is contained within the following borders: lower border 77.01 – 77.01 and upper border 77.51 – 77.51. In case the lower border is broken, the instrument is likely to follow the downward trend.
#KO M5
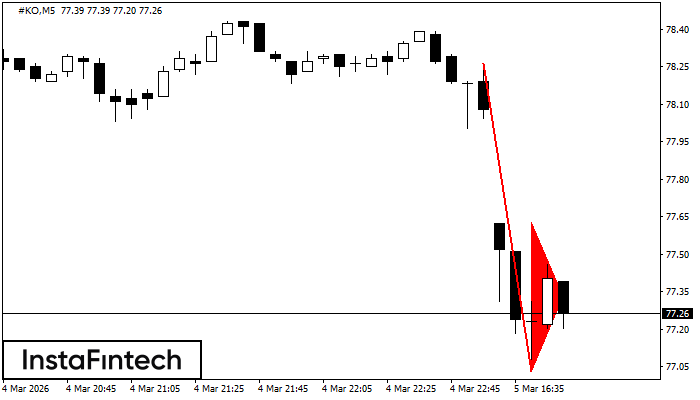
Bearish pennant
The Bearish pennant pattern has formed on the #KO M5 chart. The pattern signals continuation of the downtrend in case the pennant’s low of 77.03 is broken through. Recommendations: Place the sell stop pending order 10 pips below the pattern’s low. Place the take profit order at the projection distance of the flagpole height.
#KO M5
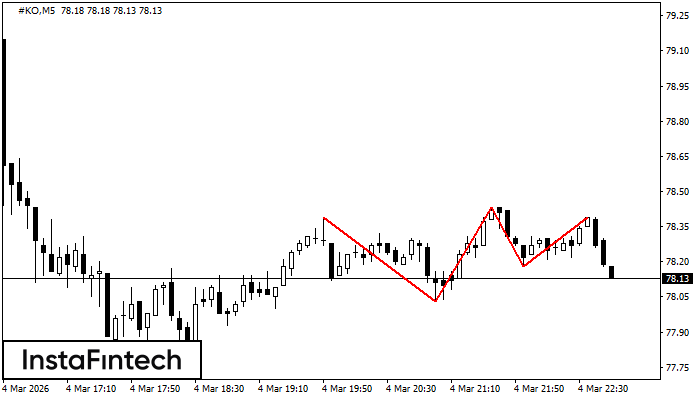
Triple Top
The Triple Top pattern has formed on the chart of the #KO M5 trading instrument. It is a reversal pattern featuring the following characteristics: resistance level 0, support level -15, and pattern’s width 36. Forecast If the price breaks through the support level 78.03, it is likely to move further down to 78.28.
#KO M30
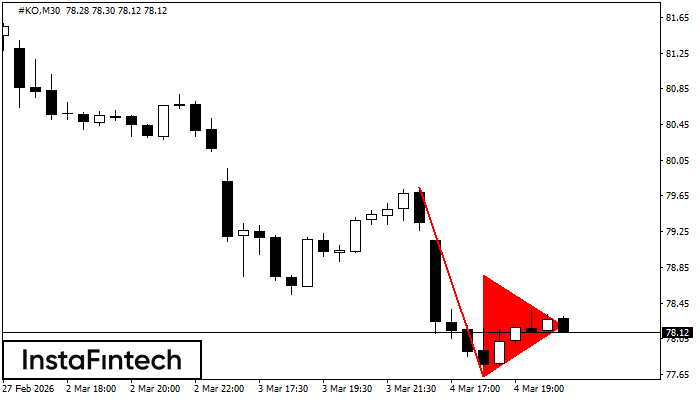
Bearish pennant
The Bearish pennant pattern has formed on the #KO M30 chart. The pattern signals continuation of the downtrend in case the pennant’s low of 77.62 is broken through. Recommendations: Place the sell stop pending order 10 pips below the pattern’s low. Place the take profit order at the projection distance of the flagpole height.
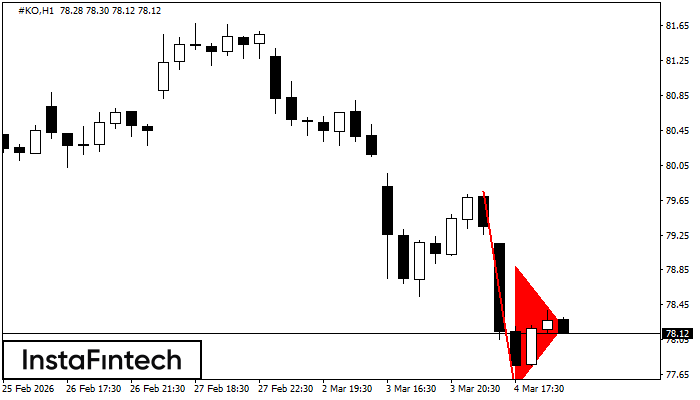
#KO H1
Bearish pennant
The Bearish pennant pattern has formed on the #KO H1 chart. The pattern signals continuation of the downtrend in case the pennant’s low of 77.50 is broken through. Recommendations: Place the sell stop pending order 10 pips below the pattern’s low. Place the take profit order at the projection distance of the flagpole height.
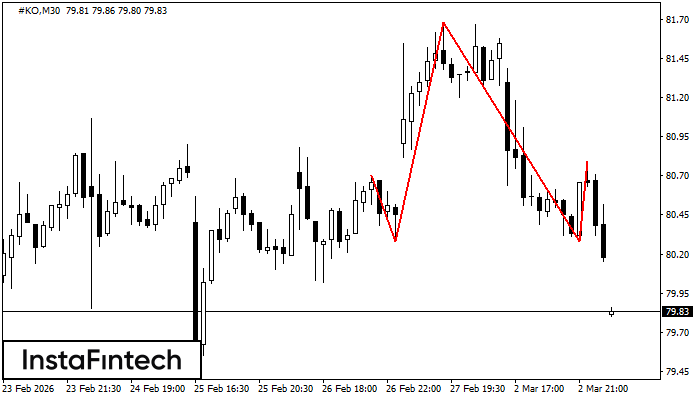
#KO M30
Head and Shoulders
The #KO M30 formed the Head and Shoulders pattern with the following features: The Head’s top is at 81.68, the Neckline and the upward angle are at 80.28/80.28. The formation of this pattern can bring about changes in the current trend from bullish to bearish. In case the pattern triggers the expected changes, the price of #KO will go towards 79.98.